
Figure 1.

The six categories of pathways through which a mutant can produce susceptible mutant singletons. Blue circles correspond to singleton classes, and red circles to pairs; the letters denote infection status and the constitutive members of the pairings. Arrows indicate movement between classes. Each pathway terminates at the stage at which production is counted; with the exception of pathways (ii) and (iii), the production is of new mutant susceptibles. Pathways (ii) and (iii) also include the possibility of pairing break-up resulting in the production of a previously existing susceptible. The loops involving  are more complicated and are shown in the inset. These loops can consist of all possible combinations and orderings of the sojourns shown. For example, if we took n = 2, j = 1, k = 0, there are two possible loops:
 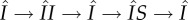 and
and 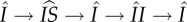 . (Online version in colour.)