
Figure 2.
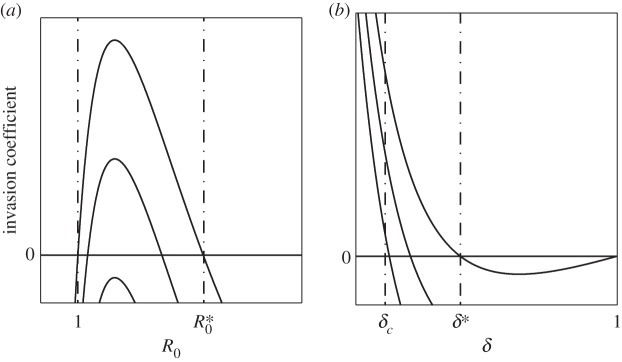
Conditions for the evolution of monogamy when pathogen causes sterility. The invasion coefficient is the left-hand side of (3.1); when it is positive, the mutant can invade. The solution of 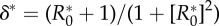 provides (a) the
  and (b) the δ*. (b) The δc used is provided in (2.2). Curves in panels (a) and (b) correspond to different values of
  : as the curves are translated downwards, catalysis costs (magnitude of
  ) increase.