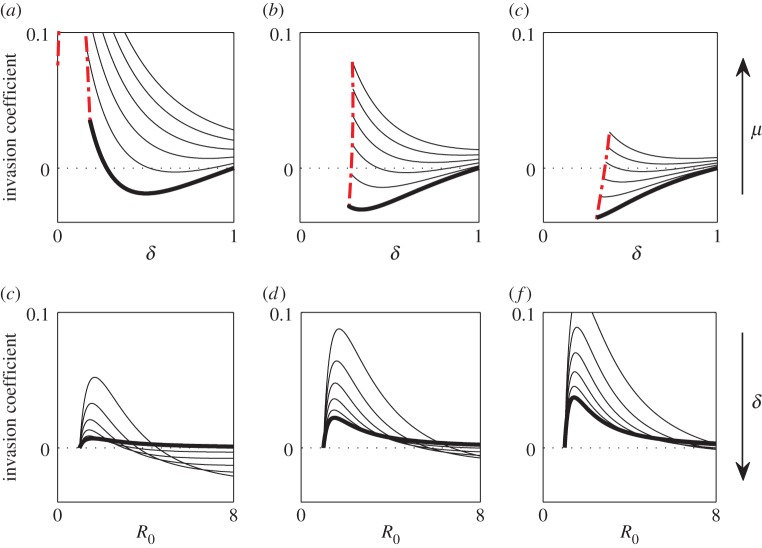
Figure 4.
Conditions for the evolution of monogamy when virulence causes sterility and mortality. The invasion coefficient is the condition for invasion; when positive, the mutant can invade. For all panels, the catalysis costs are zero; increases to these costs will reduce the likelihood of invasion while preserving the qualitative patterns. (a)–(c) Increasing probability of infection, β, while each curve corresponds to a different value of μ, starting from μ = 1 (STI does not affect mortality; thickest black curve) and increasing as indicated by the arrow to the right. The dashed red line corresponds to δc below which STI-induced sterility drives the host population to extinction. (d–f) Increasing values of μ, while each curve corresponds to a different level of sterility, δ. The direction of increase of δ is shown by the arrow to the right; as δ increases, sterility decreases. (Online version in colour.)

