
Figure 2.
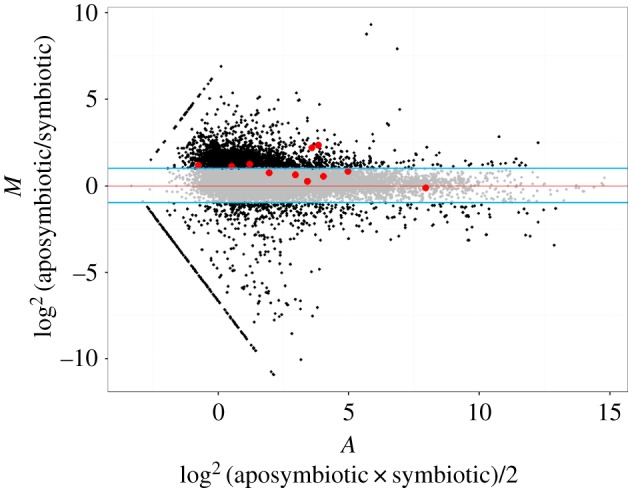
Pairwise MA plots for expressed genes among aposymbiotic and symbiotic D. fasciatus reared on their natural diet of cottonseeds. The scatter plot depicts the distribution of aposymbiotic/symbiotic log2 intensity ratio (M-value) versus the log2 average intensity (A-value). Each dot represents a single gene in comparison. The red line indicates M = 0. The upper and lower blue lines represent expression fold changes of 2 and 0.5, respectively. Grey dots represent constitutively expressed genes, black dots depict differentially expressed genes (more than twofold). B vitamin genes are designated by red dots. The lines of dots on the left side signify genes that were only observed in a single sample.