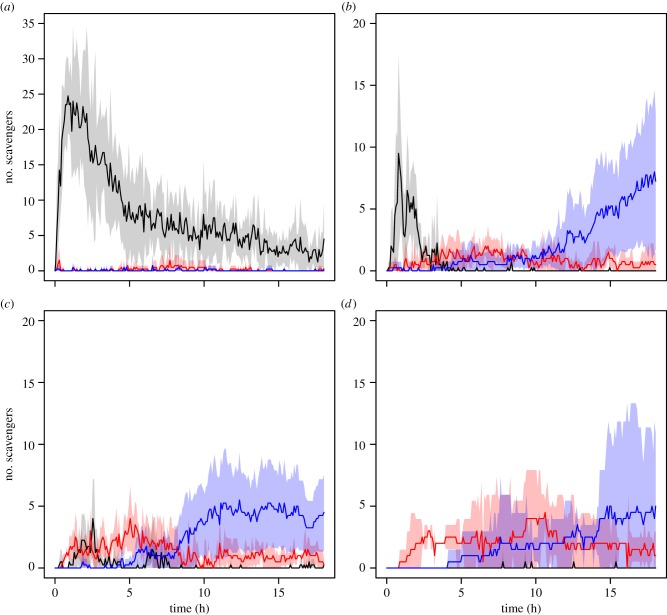
Figure 1.
Mean number of scavengers in the S. scombrus (a), P. periphylla (thawed and fresh) (b and c, respectively) and C. capillata (d) experiments as a function of time at the seafloor. Black lines and grey shading denote mean number of M. glutinosa ± 95% CIs; red line and shading denote mean number of M. tenuimana ± 95% CIs, and blue line and shading denote mean number of decapod shrimp ± 95% CIs. Note different y-axis scales.

