
Figure 2.
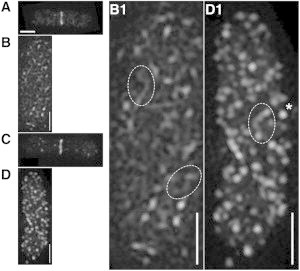
Localization of FtsZ after overproduction of SulA. (A) Cell producing FtsZ-GFP after 0.2% arabinose induction of SulA for 30 min. (B) After 45 min. (B1) Magnified cell shown in panel B. (C) Cell producing native FtsZ labeled with AlexaFluor 488 (Life Technologies, Carlsbad, CA) 30 min after induction; (D) 45 min after induction. (D1) Magnified cell shown in panel D. Scale bars, 1 μm. (Asterisk) Focus of FtsZ localization; (open dashed ovals) filamentous structures of FtsZ.