
Figure 2.
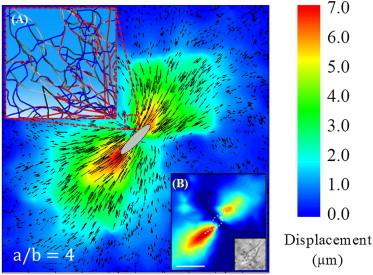
Displacement field after contraction of the cell (strain ∼ 90%). The ellipse (a/b = 4) at the center schematically shows the position of the cell before contraction. Inset A shows the aligned (red) and buckled (blue) fibers near the cell. Deformation is highly heterogeneous and localizes along the major axis of the cell as observed in experiments (inset B, adapted with permission from Gjorevski et al. (15)). Displacement vectors show the magnitude and direction of the deformation. Note the longer aligned vectors along the long axis and shorter vectors along the short axis of the cell and their random orientations. To see this figure in color, go online.