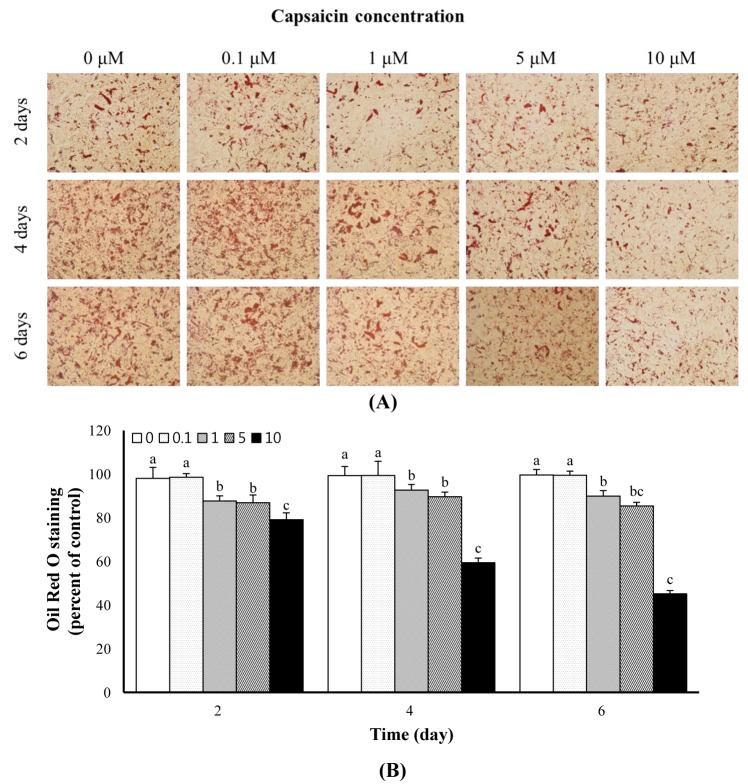
Figure 2.
Fat depositions were examined using oil red O staining. Lipid droplets were reduced in cells treated with capsaicin. (A) visualization of lipid accumulation based on oil red O staining. Capsaicin reduced lipid deposition in a dose-dependent manner. (B) number of oil red O-stained cells per microscopic field (n = 3). Values represent the means±standard error of the mean. The different letters represent significant differences compared with untreated capsaicin (0 μM) (p<0.05). The x-axis indicates the capsaicin exposure time. The y-axis indicates the percentage of oil red O stained cells.

