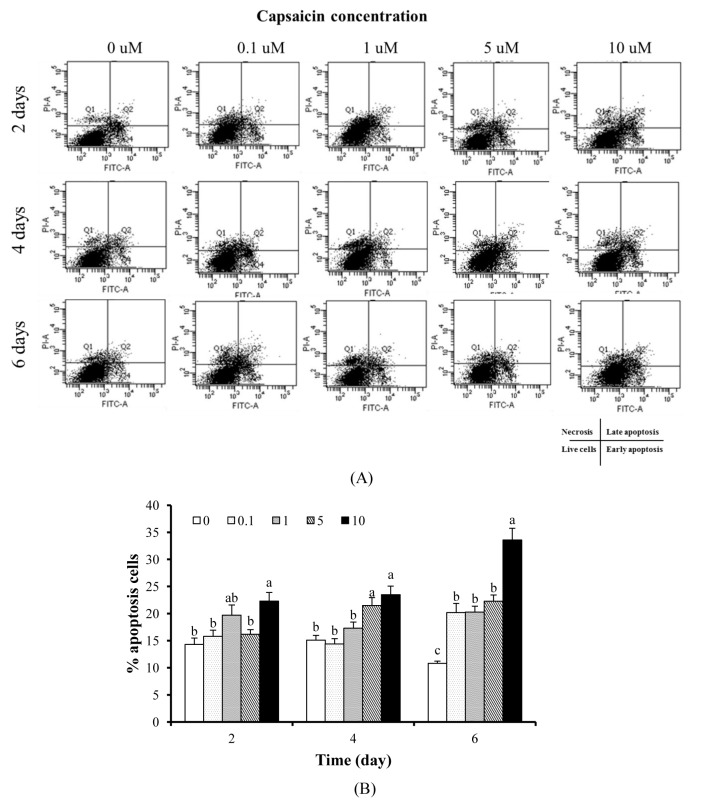
Figure 5.
Flow cytometric analysis among various capsaicin-exposed differentiating BMSC groups. (A) the histogram indicates dose-and time-dependent reduction of apoptosis with concomitant increases in annexin V-positive cells. Cell cycle was examined using PI staining. Apoptosis was analyzed using annexin V staining. PI-A, absorbance for propidium iodide; FITC-A, absorbance for fluorescein isothiocyanate (fluorescein isothiocyanate-Annexin V). Q1, necrosis; Q2, late apoptosis; Q3, live cells; Q4, early apoptosis. (B) the percentages of apoptotic cells in the presence of capsaicin at different doses and for varying times are shown. These results suggest that capsaicin treatment led to cell cycle arrest and apoptosis in time- and dose-dependent manners. Values represent the means±standard error of the mean. The different letters represent significant differences compared with the control (p<0.05). The x-axis indicates the capsaicin exposure time. The y-axis indicates the percentage of apoptotic cells.

