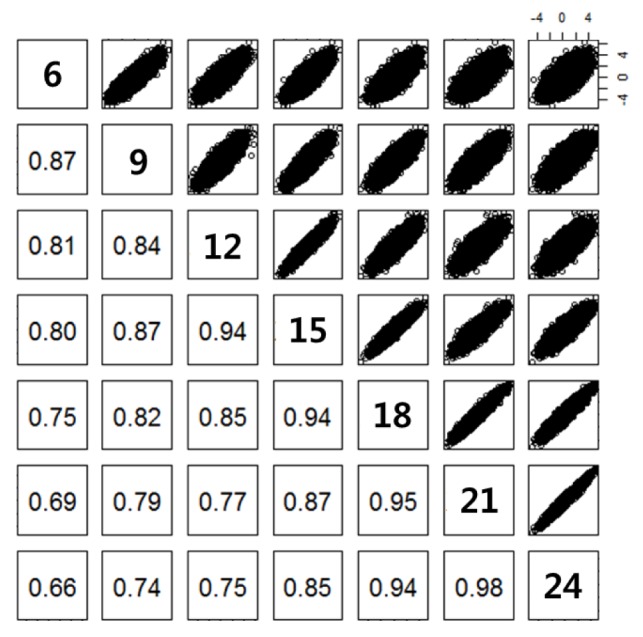
Figure 3.

Correlation of test statistics (regression coefficients) between body weights at different age. Ages in months for body weight are presented on the diagonal. Scatter plots for the regression coefficients are upper-diagonal. Correlation estimates of the regression coefficients between body weights at different age are lower-diagonal. All the correlation estimates were significant (p<0.001).
