

Abstract
By delivering optical images with spatial resolutions below the diffraction limit, several super-resolution fluorescence microscopy techniques opened new opportunities to study biological structures with details approaching molecular structure sizes. They have now become methods of choice for imaging proteins and their nanoscale dynamic organizations in live cells. In this mini-review, we describe and compare the main far-field super-resolution approaches that allow studying endogenous or overexpressed proteins in live cells.
Introduction
The decryption of cell functions and subcellular processes has constantly benefited from advances in microscopy. In particular, the developments of fluorescence microscopy and of numerous fluorescent probes allowing the study of specific biomolecules at work in their native environment were instrumental to the advance of live cell mechanism investigations. The optical resolution of microscopes is limited by the diffraction of light, which commonly sets a limit of ∼λ/2 in far-field microscopy. By delivering optical images with spatial resolutions below the diffraction limit, super-resolution fluorescence microscopy offered new promises to study molecular processes with greater detail than with conventional microscopies (1,2). Most of these methods rely on the control of the number of emitting molecules in specific imaging volumes. This can be achieved by controlling local emitter fluorescent state populations or the labeling densities of fluorescing probes at any given time during the image acquisition process. In this mini-review, we will discuss the key features of super-resolution techniques used for live-cell studies. We schematically divide them into three major groups: those based on highly localized fluorescence emission volumes; those based on structured illumination; and those based on single-molecule localizations. A didactic representation of the three families of super-resolution approaches is presented in Fig. 1.
Figure 1.
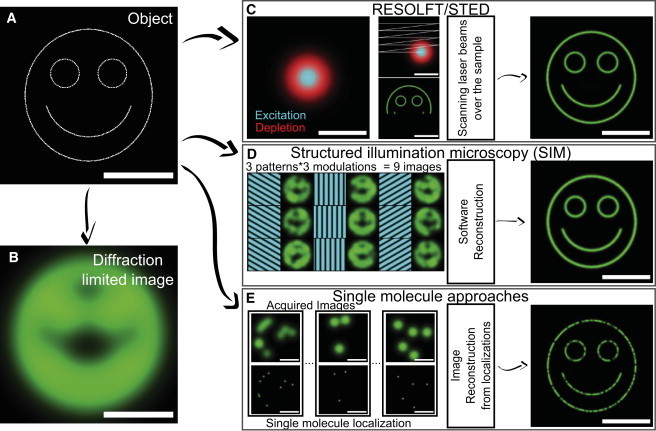
Schematic description of the superresolution microscopy approaches. All images for this didactic description are computer-generated. Object to be imaged consisted of fluorescent emitters (A) and corresponding diffraction-limited image (B). (C) In RESOLFT/STED, a focused excitation beam (cyan) superimposed with a doughnut-shaped depletion beam (red) are scanned over the sample to acquire an image at high resolution (down to ∼50–80 nm in live cells). (D) In SIM, after the required software reconstruction, multiple wide-field images are acquired using sinusoidal illumination grid patterns to obtain high-resolution images (down to ∼50–100 nm in live cells using nonlinear saturated illumination). (E) In single-molecule localization microscopy, a large number of wide-field images containing a few isolated single fluorescent emitters are successively acquired. A high-resolution image is reconstructed from the localizations of each individual molecule. Resolutions down to ∼50 nm are commonly achieved in live cells. In the example provided, we considered the detection of 80% of the molecules present in the object image. Scale bar represents 1 μm. To see this figure in color, go online.
Super-Resolution based on Highly Localized Fluorescence Emission Volumes
Stimulated emission depletion (STED) and reversible saturable optical fluorescence transition (RESOLFT)
In a far-field confocal microscope, the effective fluorescence volume can be reduced below the diffraction limit (3) by using saturable optical processes that deexcite emitters formerly excited by a focused laser beam. These processes work to prevent fluorescence emission from specific regions of the excitation beam by driving the molecules in these regions between bright and dark states using a depletion light beam. One elegant and efficient strategy consists of using stimulated emission by a high-intensity (>MW/cm2), doughnut-shaped laser beam superimposed with the focused excitation laser beam, completely preventing fluorescence emission from emitters in peripheral regions of the excitation beam. This process was coined “stimulated emission depletion” (STED) (3). A doughnut-shaped depletion beam is the simplest design; however, in general, any depletion beam featuring a spatial intensity distribution with one or several intensity zeroes can be used to perform STED images.
To generate a super-resolved image with STED based on local excitation volumes, one must scan the excitation/depletion effective volumes over the sample in a deterministic point-by-point manner or by use of parallelized scanning schemes (4,5). STED was successfully applied in several live samples to study slow morphing and movements of organelles such as reticulum endoplasmic or microtubules (6), subcellular organization in live cells (7), and synaptic structures in live samples (7–9). For live cell studies, one should bear in mind that relatively high laser powers are needed in STED, especially when using continuous wave laser beams (e.g., ∼MW/cm2 (10)). Using pulsed excitation beam together with time-gating detection allowed a ∼2–3-fold reduction in laser power (11). In addition, photobleaching is a limiting factor for long-term live sample imaging because each fluorescent molecule undergoes a large number of exciting/de-exciting cycles in the depletion beam.
An approach similar to STED using much lower intensities to deplete emitting molecular levels (∼kW/cm2) (12) is based on reversible photoswitching of marker proteins between a fluorescence-activated and a nonactivated state (13–15), whereby one of the transitions is accomplished by means of a spatial intensity distribution featuring a zero. This generalized approach was named after “reversible saturable optical fluorescence transition” (RESOLFT). Bright photostable switchable fluorophores and fluorescent proteins development were particularly instrumental in the development of these techniques (14–16). Importantly, fluorescent proteins provide specific 1:1 protein labeling and offer the possibility of intracellular live cell imaging.
Structured Illumination Microscopy (SIM)
Structured illumination microscopy (SIM) is based on standard wide-field microscopy and is compatible with most standard fluorophores and labeling protocols. It uses nonuniform illuminations with known spatial patterns (e.g., originally a sinusoidal grid, but other illumination distributions can also be used (17)). From multiple acquisitions (e.g., nine images, incorporating three phase shifts for three pattern orientations (18)), high spatial frequency information is retrieved with a dedicated algorithm, comprising a method inaccessible with standard illumination schemes (19). Contrary to standard laser scanning modalities like STED/RESOLFT, SIM allows acquisition of a large field of view over limited times. However, SIM routinely provides only an approximately twofold resolution enhancement of standard wide-field microscopy as compared to other super-resolution methods (19). Nonlinear saturated SIM using fluorophore saturation or photoswitchable proteins as in RESOLFT can achieve higher resolution enhancement (∼50 nm), but requires an increased number of image acquisitions (up to 63) and a complex reconstruction process (20,21). SIM has been demonstrated for long-term, live cell imaging in microtubules and other dynamic structures (21–23). Three-dimensional SIM imaging has been further achieved using 15 different pattern acquisitions per axial planes for reconstruction instead of nine images to reject the out-of-focus light (24). Whole-cell volume imaging has been performed using three-dimensional SIM in two colors (25). And, interestingly, fast SIM imaging (11 Hz) has even been developed with a 100-nm resolution for a small field of view (∼8 × 8 μm2) (18).
Single-Molecule Localization Microscopy Approaches
It is well known that the position of isolated single fluorescent emitters can be determined by image analysis with greater precision than is available from the diffraction limit alone. This feature, which has been used for more than 20 years in live cell, single-particle/-molecule studies (26), is key to providing today’s super-resolved images. Super-resolution methods based on single-molecule localizations simply consist of reconstructing an image from single molecule localizations retrieved from a large number of movie frames (typically thousands of camera frames). The main requirement is that each frame contains the detection of spatially well-separated fluorescent emitters (27). Inasmuch as a large volume of single-molecule detections must to be registered to reconstruct a high-content super-resolved image, this acquisition process is inherently slow (typically more than a few seconds). Below, we describe three families of such approaches, distinguishing how fluorescent molecules are stochastically isolated from nonfluorescent ones in each camera frame.
Photoactivation localization microscopy (PALM)
The development of photoactivation localization microscopy (PALM) (28,29) is closely linked to the advent of photoactivatable proteins (16), which allows us to control, by light, the density of fluorescing proteins in each image. Although it is restricted to expression systems, preventing the study of endogenous proteins in their native environment, PALM takes advantage of the versatility and specificity of genetically encoded, fluorescently tagged molecules in cells, and has quickly become the tool of choice for super-resolution live cell imaging. PALM, by design, is not restricted to biomolecules present at the cell plasma membrane, and allows the study of intracellular biomolecules. By tracking the movement of each individual protein, PALM also allows measuring local diffusion properties in living cells on short timescales (30–32) and cellular structural changes in three dimensions on longer timescales (33).
Stochastic optical reconstruction microscopy (STORM) and ground state depletion microscopy followed by individual molecular return (GSDIM)
Stochastic optical reconstruction microscopy (STORM) (34) and direct STORM (dSTORM) (35) use switchable organic fluorophores placed in specific buffers (e.g., with reducing properties) instead of using fluorescent proteins as in PALM. Those probes can be targeted on genetically encoded or endogenous proteins using adequate ligands. STORM was first demonstrated using Cy3-Cy5 pairs (34) but was quickly extended in dSTORM to other synthetic fluorophores that can be stochastically and reversibly switched in the imaging buffers (36,37). STORM is particularly powerful for fixed cells applications (38–40), and can be extended in three dimensions (38). One caution is that live cell experiments should be performed with great care due to possible issues with the use of reducing/oxidizing buffers that can affect cell integrity (41). Of special interest is that STORM has been shown to take advantage of some reduction in thiol glutathione, which is naturally present at millimolar concentrations in bacteria (42) or in specific cell compartments such as the nuclei of eukaryote cells when using buffers with low cellular toxicity (43,44). Organelles from live cells such as the membrane and mitochondria have also been investigated using multicolor STORM (45–47).
Analogously to dSTORM, where stochastic photoswitching is used to control the number of emitting fluorophores, ground state depletion microscopy followed by individual molecular return (GSDIM) covers the techniques employing the transition between the fluorescent singlet state and the metastable triplet state as a stochastic on-off switch (48,49). More precisely, efficient transition to the long-lived triplet state is achieved in such techniques by using high-excitation intensities combined with an imaging buffer, similar to STORM, to allow obtaining triplet lifetimes just long enough to leave only a few emitting fluorophores at any time in each image. Under these conditions, GSDIM has been employed for imaging living cells using both fluorescent protein tags (as in PALM) or various organic fluorophores (as in STORM) that selectively bind to tagged proteins (50,51).
Universal point accumulation imaging in the nanoscale topography (uPAINT)
In contrast with PALM, STORM, and GSDIM, which are based on the emitters stochastic photoswitching, the method known as “universal point accumulation imaging in the nanoscale topography” (uPAINT) (52–55) captures real-time molecular interactions to control the density of fluorescent emitters suitable for single molecule identification in each image. In the uPAINT approach, target molecules are individually imaged when a specific ligand coupled to a fluorescent dye binds to the target molecule.
Unbound ligands freely diffuse in the imaging buffer (with typical diffusion constants of approximately tens of μm2/s) and, due to an oblique illumination excitation, are not excited in an efficient manner. Therefore, unbound ligands are not detected efficiently by a detector operating at a typical video rate, in contrast to bound ligands, which diffuse together with a membrane receptor (with typical diffusion constants of <1 μm2/s) in the oblique laser illumination. With uPAINT, any binding entity conjugated to fluorophores having high specificity toward a target molecule (e.g., natural/synthetic ligand, antibody) can be used as fluorescent probes to reveal the targeted molecules. Applications include receptors and GPI-anchored proteins diffusing on live cell membranes labeled with antibodies or synthetic ligands. uPAINT was also applied to image and track endogenous receptors such as glutamate receptors in neurons (54) and epidermal growth factor receptors (EGFRs) at high densities in culture living cells (56). Comparisons between transfected nonendogenous receptors and endogenous glutamate receptors were also performed (57).
A similar approach allowed tracking and imaging by continuously labeling sodium ion channels in live cells, using small fluorescently labeled molecule agents that display reversible binding to the sodium ion channel (58). Interestingly, combining single-molecule fluorescence resonance energy transfer and dual-color uPAINT allowed the specific super-resolution imaging and tracking of interacting receptors activated by their cognate ligand in live cells (56). This feature stems from the fact that in this uPAINT study, fluorescently tagged ligands are directly used as imaging probes, allowing us to extract and image the population of activated functional receptors upon ligand binding in real-time. Examples of high resolution images obtained based on highly localized fluorescence emission volumes, structured illumination microscopy and single-molecule localization microscopy are presented in Fig. 2 .
Figure 2.
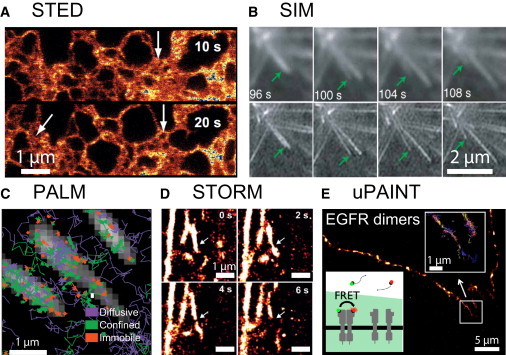
Examples of achievements obtained with superresolution microscopy in live biological samples. (A) STED: continuous-wave STED images of the yellow fluorescent protein (citrine) targeted to the endoplasmic reticulum in live cells revealing small tubules (∼60 nm). Image sequences show morphing of the endoplasmic reticulum at arrows (pixel size = 20 nm, 10 s recording time per image). Scale bar = 1 μm. This figure was adapted from Hein et al. (6). (B) SIM: total-internal reflection microscopy image series of eGFP-α-tubulin in a live S2 cell and corresponding SIM images revealing the elongation followed by a rapid shrinking of a microtubule. Integration time of 270 ms per frame. This figure was adapted from Kner et al. (18). (C) PALM: numerous single trajectories of β3-integrin fused with mEOS2, obtained on a single MEF cell with PALM, revealing that β3-integrin undergo slower free-diffusion inside focal adhesions (gray) than outside, as well as confined diffusion and immobilization. Figure adapted from Rossier et al. (31). (D) STORM: spatial dynamics of cortical actin skeleton stained with Lifeact-HaloTag/ATTO655. Each reconstruction was obtained using 1000 frames (2 ms per frame). Scale bar = 1 μm. This figure was adapted from Wilmes et al. (47). (E) uPAINT: live cell superresolution imaging of membrane epidermal growth factor receptor (EGFR) dimers based on single-molecule fluorescence resonance energy transfer induced by fluorescent ligand activation. (Inset) Preferential cell-edge localization of EGFR dimers. In addition, uPAINT provides numerous single-molecule trajectories on a single cell, allowing the extraction of the diffusion properties of the EGFR dimer population from the whole-ligand-activated EGFR population. This figure was adapted from Winckler et al. (56). To see this figure in color, go online.
Discussion
Dynamics and resolution in live cells
In live cells or organisms, supramolecular structures and organelles morph often in reaction to stimuli (seconds to minutes and up to hours) over relatively short timescales. To fully understand the cell signaling that induces those processes, it is important to investigate therein the dynamics of molecular (re)organizations. In particular, to grasp the full spectrum of mobility behaviors of biomolecules (up to 1 μm2/s for membrane receptors), fast video rate acquisition is required (20–100 Hz) on large fields of view. Yet, in all super-resolution methods, breaking the diffraction limit on a given field of view comes at the expense of the acquisition time.
In point scanning RESOLFT/STED methods, a compromise between imaging large fields of view and fast acquisition speed has to be made because of the requirement for a dense pixilation. Imaging rates in RESOLFT are rather slow because pixel integration times are limited by the protein photoswitching processes. Being based on stimulated emission, STED is not subject to this fundamental limit. However, increased resolution being achieved with high laser powers, care should be taken to ensure live cell integrity. RESOLFT/STED methods are able to resolve the movements of the slow structures (typically 10–30 s for 512 × 512 pixels) such as, for instance, microtubule networks organizations (22,59) and neuron morphology dynamics (60,61), in cell cultures and live animals. Interestingly, by acquiring small fields of view, the dynamics of nanoscale structures can be monitored with higher imaging rates (28 Hz for 60 × 82 pixels) (62). Recently, large parallelization of the depletion patterns combined with the use of matrix detectors drastically increased imaging speed over large field of view in RESOLFT (59) and STED (5).
In its standard form, SIM uses nine wide-field fluorescent images to build a super-resolved image in typically 1 s. Many applications of SIM were described for imaging subcellular structures in living cells (18,23,25). With saturated SIM (the structured illumination approach giving better spatial resolution), additional illumination patterns are needed for the reconstruction (21), leading to degraded time resolution. Important to note for SIM techniques is that any aberration, sample movement, or fluorophore photobleaching during the image sequence will induce artifacts that will strongly affect the quality of reconstructed super-resolved images (18).
In single-molecule localization approaches, two timescales are relevant:
-
1.
Raw-images acquisition rate. This sets the individual molecules’ tracking time resolution (1–10 of ms). This rate also sets the single-molecule pointing accuracy through its impact on the signal/noise of each molecular detection (63,64). The analysis of single-molecule trajectories provides local mobility maps on live cell regions with high spatiotemporal resolutions (30–32,54,57)
-
2.
Total number of images needed to reconstruct a super-resolved image (which sets the rate). Indeed, in addition to the pointing accuracy, the local density of single-molecule detections obtained from a studied structure also plays a central role in the final spatial resolution (as announced by the Nyquist theorem). For instance, to obtain images with 10-nm resolution, local densities of at least 10,000 detection/μm2 are needed. Hence, thousands of image frames are commonly acquired, justifying global recording times of approximately seconds to minutes. This timescale directly defines the time resolution at which nanoscale organization of molecular assemblies (e.g.. cellular organelles) can be analyzed.
Computer analysis requirements
Conversely to RESOLFT/STED methods that do not require any postacquisition analysis, the main source of SIM’s complexity lies in the sophisticated algorithms required for image reconstruction. As in single-molecule localization-based techniques, positions of the emitting single molecules must be retrieved using cutting-edge software (described in a recent comparative study (65)).
Labeling strategies and consequences
Expression systems in concert with fluorescent protein engineering provide a method of choice to study, with high specificity, subcellular organizations in live cells, making RESOLFT, SIM, and PALM essential methods for the applications described in this review. However, despite their wide applicability, one should bear in mind that some signaling and structural artifacts can arise due to the use of fluorescent proteins (66). In this context, using fluorophores conjugated to specific ligands, the methods SIM, uPAINT, STED, and to some extent, STORM/GSDIM, should be considered, inasmuch as they are compatible with studying endogenous receptors in living cells. Interestingly, by synchronizing single-molecule detection and ligand-induced receptor activation, uPAINT is, to date, the only super-resolution method that allows studying, in real-time, specifically activated functional receptors and their interactions at the membrane of living cells (56).
Of note, protein number quantification can in principle be performed using PALM and uPAINT, inasmuch as, in these methods, photobleaching irreversibly turns off fluorophores after their detection. In STORM/GSDIM, however, reversible stochastic switching of fluorophores can bias such quantitative analysis because observing the same fluorescent molecules more than once is plausible. Interestingly, recent advances in self-labeling proteins such as the SNAP, CLIP, and Halo tags, allow efficient live cell protein labeling, including intracellular ones (46,51,67), and provide valuable tools to perform multicolor super-resolution imaging that can, in principle, be applied to STED, STORM, or uPAINT.
Studying structures in three dimensions
Several methods were developed to improve axial resolution in fluorescence imaging. The most widely used strategies are based on single-molecule localization and provide axial information (∼20–70 nm) of the position without severely altering either the radial or time precision. By shaping the detection point-spread function along the axial position, single-molecule position can be precisely determined along the optical axis (38,68,69). Detecting molecules using two objectives (70,71), by moving the sample in the axial direction (72) or by interfering the signals obtained from two objectives (73,74), could also yield similar resolution improvements along the optical axis. Although the last approach is the most precise (∼20 nm), it is also the most complex to implement. Finally, STED/RESOLFT can also be extended in three dimensions by scanning distinct axial planes independently (9).
Summary
Super-resolution approaches described in this mini-review were proven to deliver information on subcellular organization at different timescales using various labeling probes. Table 1 summarizes the main pros/cons of the approaches discussed here and outlines the different spatiotemporal fundamental limits.
Table 1.
Comparison of the superresolution approaches presented in this review
| Approach | STED | RESOLFT | SIM | Single-molecule approaches |
||
|---|---|---|---|---|---|---|
| PALM | STORM/GSDIM | uPAINT | ||||
| Resolution (live samples) | 50–70 nm | 80–100 nm | 50c–100 nm | 50 nm | 50 nm | 50 nm |
| Toxicity | ++ | +++ | +++ | +++ | + | +++ |
| Endogenous | +++ | — | +++ | — | +++ | +++ |
| Time for single image (a field of 50 × 50 μm is considered for comparison) | 10–100 s ∼0.1 sa | >500 s ∼ 3 sb | ∼1 s | > 2 s | > 2 s | > 2 s |
| Intracellular labeling (live) | + | +++ | +++ | +++ | + | — |
| Implementation complexity | + | + | + | +++ | +++ | +++ |
| Reconstruction algorithm | N.A.a | N.A.b | + | ++ | ++ | ++ |
| Dynamics of large molecular structures | +++ | +++ | +++ | ++ | ++ | ++ |
| Dynamics of single molecule | + | + | + | +++ | ++ | +++ |
| Multicolor imaging | + | ++ | +++ | ++ | +++ | +++ |
Parallelization of STED nanoscopy using optical lattices was recently achieved with an imaging rate of 12.5 Hz for a 2.9 × 2.9 μm image (5). It requires a simple reconstruction algorithm.
Large parallelization of the depletion patterns drastically increased imaging speed over a larger field of view in RESOLFT (120 × 100 μm in ∼3 s (59)). It requires a simple reconstruction algorithm.
Using nonlinear saturated SIM allows accuracy enhancement up to 50 nm (21).
Conclusion
During the last two decades, super-resolution approaches have provided new insights into subcellular organization at nanometer-scale resolutions. Several of these methods have reached a sufficient level of maturity to make them routinely applicable to many biological systems. As described in this mini-review, each approach has its own advantages and drawbacks for live cell imaging. However, in combining these techniques, one can tackle specific biological questions to take advantage of the strengths of each method, such as the insurance of orthogonal labeling for multicolor imaging (47).
Other recent approaches can also be implemented to increase the image resolution by a factor of 2–4 upon applying software analytical tools to standard experimental imaging data sets. These include deconvolution microscopy (75), stochastic optical fluctuation imaging (76), Bayesian localization microscopy (77), and compressed sensing (78–80). We foresee that correlating the information gathered by such specific molecular imaging methods with structural information obtained by electron microscopy will provide new insights into molecular subcellular organization and interaction.
Acknowledgments
We acknowledge financial support from the Fondation pour la Recherche Medicale, Fonds de Recherche Nature et Technologies du Quebec (to A.G.G.), Agence Nationale de la Recherche, Region Aquitaine, the French Ministry of Education and Research, the Centre National de la Research Scientifique, the European Research Council, and FranceBioImaging (grant No. ANR-10-INSB-04-01).
References
- 1.Hell S.W. Far-field optical nanoscopy. Science. 2007;316:1153–1158. doi: 10.1126/science.1137395. [DOI] [PubMed] [Google Scholar]
- 2.Huang B., Bates M., Zhuang X. Super-resolution fluorescence microscopy. Annu. Rev. Biochem. 2009;78:993–1016. doi: 10.1146/annurev.biochem.77.061906.092014. [DOI] [PMC free article] [PubMed] [Google Scholar]
- 3.Hell S.W., Wichmann J. Breaking the diffraction resolution limit by stimulated emission: stimulated-emission-depletion fluorescence microscopy. Opt. Lett. 1994;19:780–782. doi: 10.1364/ol.19.000780. [DOI] [PubMed] [Google Scholar]
- 4.Bingen P., Reuss M., Hell S.W. Parallelized STED fluorescence nanoscopy. Opt. Express. 2011;19:23716–23726. doi: 10.1364/OE.19.023716. [DOI] [PubMed] [Google Scholar]
- 5.Yang B., Przybilla F., Lounis B. Large parallelization of STED nanoscopy using optical lattices. Opt. Express. 2014;22:5581–5589. doi: 10.1364/OE.22.005581. [DOI] [PubMed] [Google Scholar]
- 6.Hein B., Willig K.I., Hell S.W. Stimulated emission depletion (STED) nanoscopy of a fluorescent protein-labeled organelle inside a living cell. Proc. Natl. Acad. Sci. USA. 2008;105:14271–14276. doi: 10.1073/pnas.0807705105. [DOI] [PMC free article] [PubMed] [Google Scholar]
- 7.Westphal V., Rizzoli S.O., Hell S.W. Video-rate far-field optical nanoscopy dissects synaptic vesicle movement. Science. 2008;320:246–249. doi: 10.1126/science.1154228. [DOI] [PubMed] [Google Scholar]
- 8.Nägerl U.V., Willig K.I., Bonhoeffer T. Live-cell imaging of dendritic spines by STED microscopy. Proc. Natl. Acad. Sci. USA. 2008;105:18982–18987. doi: 10.1073/pnas.0810028105. [DOI] [PMC free article] [PubMed] [Google Scholar]
- 9.Tønnesen J., Katona G., Nägerl U.V. Spine neck plasticity regulates compartmentalization of synapses. Nat. Neurosci. 2014;17:678–685. doi: 10.1038/nn.3682. [DOI] [PubMed] [Google Scholar]
- 10.Willig K.I., Harke B., Hell S.W. STED microscopy with continuous wave beams. Nat. Methods. 2007;4:915–918. doi: 10.1038/nmeth1108. [DOI] [PubMed] [Google Scholar]
- 11.Vicidomini G., Moneron G., Hell S.W. Sharper low-power STED nanoscopy by time gating. Nat. Methods. 2011;8:571–573. doi: 10.1038/nmeth.1624. [DOI] [PubMed] [Google Scholar]
- 12.Testa I., Urban N.T., Hell S.W. Nanoscopy of living brain slices with low light levels. Neuron. 2012;75:992–1000. doi: 10.1016/j.neuron.2012.07.028. [DOI] [PubMed] [Google Scholar]
- 13.Hofmann M., Eggeling C., Hell S.W. Breaking the diffraction barrier in fluorescence microscopy at low light intensities by using reversibly photoswitchable proteins. Proc. Natl. Acad. Sci. USA. 2005;102:17565–17569. doi: 10.1073/pnas.0506010102. [DOI] [PMC free article] [PubMed] [Google Scholar]
- 14.Dedecker P., Hotta J., Hofkens J. Subdiffraction imaging through the selective donut-mode depletion of thermally stable photoswitchable fluorophores: numerical analysis and application to the fluorescent protein Dronpa. J. Am. Chem. Soc. 2007;129:16132–16141. doi: 10.1021/ja076128z. [DOI] [PubMed] [Google Scholar]
- 15.Grotjohann T., Testa I., Hell S.W. Diffraction-unlimited all-optical imaging and writing with a photochromic GFP. Nature. 2011;478:204–208. doi: 10.1038/nature10497. [DOI] [PubMed] [Google Scholar]
- 16.Patterson G.H., Lippincott-Schwartz J. A photoactivatable GFP for selective photolabeling of proteins and cells. Science. 2002;297:1873–1877. doi: 10.1126/science.1074952. [DOI] [PubMed] [Google Scholar]
- 17.Gao L., Shao L., Betzig E. Noninvasive imaging beyond the diffraction limit of 3D dynamics in thickly fluorescent specimens. Cell. 2012;151:1370–1385. doi: 10.1016/j.cell.2012.10.008. [DOI] [PMC free article] [PubMed] [Google Scholar]
- 18.Kner P., Chhun B.B., Gustafsson M.G. Super-resolution video microscopy of live cells by structured illumination. Nat. Methods. 2009;6:339–342. doi: 10.1038/nmeth.1324. [DOI] [PMC free article] [PubMed] [Google Scholar]
- 19.Gustafsson M.G. Surpassing the lateral resolution limit by a factor of two using structured illumination microscopy. J. Microsc. 2000;198:82–87. doi: 10.1046/j.1365-2818.2000.00710.x. [DOI] [PubMed] [Google Scholar]
- 20.Gustafsson M.G. Nonlinear structured-illumination microscopy: wide-field fluorescence imaging with theoretically unlimited resolution. Proc. Natl. Acad. Sci. USA. 2005;102:13081–13086. doi: 10.1073/pnas.0406877102. [DOI] [PMC free article] [PubMed] [Google Scholar]
- 21.Rego E.H., Shao L., Gustafsson M.G. Nonlinear structured-illumination microscopy with a photoswitchable protein reveals cellular structures at 50-nm resolution. Proc. Natl. Acad. Sci. USA. 2012;109:E135–E143. doi: 10.1073/pnas.1107547108. [DOI] [PMC free article] [PubMed] [Google Scholar]
- 22.York A.G., Parekh S.H., Shroff H. Resolution doubling in live, multicellular organisms via multifocal structured illumination microscopy. Nat. Methods. 2012;9:749–754. doi: 10.1038/nmeth.2025. [DOI] [PMC free article] [PubMed] [Google Scholar]
- 23.Olshausen P.V., Defeu Soufo H.J., Rohrbach A. Super-resolution imaging of dynamic MreB filaments in B. subtilis—a multiple-motor-driven transport? Biophys. J. 2013;105:1171–1181. doi: 10.1016/j.bpj.2013.07.038. [DOI] [PMC free article] [PubMed] [Google Scholar]
- 24.Shao L., Kner P., Gustafsson M.G. Super-resolution 3D microscopy of live whole cells using structured illumination. Nat. Methods. 2011;8:1044–1046. doi: 10.1038/nmeth.1734. [DOI] [PubMed] [Google Scholar]
- 25.Fiolka R., Shao L., Gustafsson M.G. Time-lapse two-color 3D imaging of live cells with doubled resolution using structured illumination. Proc. Natl. Acad. Sci. USA. 2012;109:5311–5315. doi: 10.1073/pnas.1119262109. [DOI] [PMC free article] [PubMed] [Google Scholar]
- 26.Cognet L., Leduc C., Lounis B. Advances in live-cell single-particle tracking and dynamic super-resolution imaging. Curr. Opin. Chem. Biol. 2014;20:78–85. doi: 10.1016/j.cbpa.2014.04.015. [DOI] [PubMed] [Google Scholar]
- 27.Betzig E. Proposed method for molecular optical imaging. Opt. Lett. 1995;20:237–239. doi: 10.1364/ol.20.000237. [DOI] [PubMed] [Google Scholar]
- 28.Betzig E., Patterson G.H., Hess H.F. Imaging intracellular fluorescent proteins at nanometer resolution. Science. 2006;313:1642–1645. doi: 10.1126/science.1127344. [DOI] [PubMed] [Google Scholar]
- 29.Hess S.T., Girirajan T.P., Mason M.D. Ultra-high resolution imaging by fluorescence photoactivation localization microscopy. Biophys. J. 2006;91:4258–4272. doi: 10.1529/biophysj.106.091116. [DOI] [PMC free article] [PubMed] [Google Scholar]
- 30.Manley S., Gillette J.M., Lippincott-Schwartz J. High-density mapping of single-molecule trajectories with photoactivated localization microscopy. Nat. Methods. 2008;5:155–157. doi: 10.1038/nmeth.1176. [DOI] [PubMed] [Google Scholar]
- 31.Rossier O., Octeau V., Giannone G. Integrins β1 and β3 exhibit distinct dynamic nanoscale organizations inside focal adhesions. Nat. Cell Biol. 2012;14:1057–1067. doi: 10.1038/ncb2588. [DOI] [PubMed] [Google Scholar]
- 32.Gudheti M.V., Curthoys N.M., Hess S.T. Actin mediates the nanoscale membrane organization of the clustered membrane protein influenza hemagglutinin. Biophys. J. 2013;104:2182–2192. doi: 10.1016/j.bpj.2013.03.054. [DOI] [PMC free article] [PubMed] [Google Scholar]
- 33.Fu G., Huang T., Xiao J. In vivo structure of the E. coli FtsZ-ring revealed by photoactivated localization microscopy (PALM) PLoS ONE. 2010;5:e12682. doi: 10.1371/journal.pone.0012680. [DOI] [PMC free article] [PubMed] [Google Scholar]
- 34.Rust M.J., Bates M., Zhuang X. Sub-diffraction-limit imaging by stochastic optical reconstruction microscopy (STORM) Nat. Methods. 2006;3:793–795. doi: 10.1038/nmeth929. [DOI] [PMC free article] [PubMed] [Google Scholar]
- 35.Wombacher R., Heidbreder M., Sauer M. Live-cell super-resolution imaging with trimethoprim conjugates. Nat. Methods. 2010;7:717–719. doi: 10.1038/nmeth.1489. [DOI] [PubMed] [Google Scholar]
- 36.Heilemann M., van de Linde S., Sauer M. Super-resolution imaging with small organic fluorophores. Angew. Chem. Int. Ed. Engl. 2009;48:6903–6908. doi: 10.1002/anie.200902073. [DOI] [PubMed] [Google Scholar]
- 37.Schermelleh L., Heintzmann R., Leonhardt H. A guide to super-resolution fluorescence microscopy. J. Cell Biol. 2010;190:165–175. doi: 10.1083/jcb.201002018. [DOI] [PMC free article] [PubMed] [Google Scholar]
- 38.Huang B., Wang W., Zhuang X. Three-dimensional super-resolution imaging by stochastic optical reconstruction microscopy. Science. 2008;319:810–813. doi: 10.1126/science.1153529. [DOI] [PMC free article] [PubMed] [Google Scholar]
- 39.Dani A., Huang B., Zhuang X. Super-resolution imaging of chemical synapses in the brain. Neuron. 2010;68:843–856. doi: 10.1016/j.neuron.2010.11.021. [DOI] [PMC free article] [PubMed] [Google Scholar]
- 40.Löschberger A., van de Linde S., Sauer M. Super-resolution imaging visualizes the eightfold symmetry of gp210 proteins around the nuclear pore complex and resolves the central channel with nanometer resolution. J. Cell Sci. 2012;125:570–575. doi: 10.1242/jcs.098822. [DOI] [PubMed] [Google Scholar]
- 41.Jones S.A., Shim S.H., Zhuang X. Fast, three-dimensional super-resolution imaging of live cells. Nat. Methods. 2011;8:499–508. doi: 10.1038/nmeth.1605. [DOI] [PMC free article] [PubMed] [Google Scholar]
- 42.Wang W., Li G.W., Zhuang X. Chromosome organization by a nucleoid-associated protein in live bacteria. Science. 2011;333:1445–1449. doi: 10.1126/science.1204697. [DOI] [PMC free article] [PubMed] [Google Scholar]
- 43.Klein T., Löschberger A., Sauer M. Live-cell dSTORM with SNAP-tag fusion proteins. Nat. Methods. 2011;8:7–9. doi: 10.1038/nmeth0111-7b. [DOI] [PubMed] [Google Scholar]
- 44.Benke A., Manley S. Live-cell dSTORM of cellular DNA based on direct DNA labeling. ChemBioChem. 2012;13:298–301. doi: 10.1002/cbic.201100679. [DOI] [PubMed] [Google Scholar]
- 45.Shim S.H., Xia C., Zhuang X. Super-resolution fluorescence imaging of organelles in live cells with photoswitchable membrane probes. Proc. Natl. Acad. Sci. USA. 2012;109:13978–13983. doi: 10.1073/pnas.1201882109. [DOI] [PMC free article] [PubMed] [Google Scholar]
- 46.Benke A., Olivier N., Manley S. Multicolor single molecule tracking of stochastically active synthetic dyes. Nano Lett. 2012;12:2619–2624. doi: 10.1021/nl301018r. [DOI] [PubMed] [Google Scholar]
- 47.Wilmes S., Staufenbiel M., Piehler J. Triple-color super-resolution imaging of live cells: resolving submicroscopic receptor organization in the plasma membrane. Angew. Chem. Int. Ed. Engl. 2012;51:4868–4871. doi: 10.1002/anie.201200853. [DOI] [PubMed] [Google Scholar]
- 48.Fölling J., Bossi M., Hell S.W. Fluorescence nanoscopy by ground-state depletion and single-molecule return. Nat. Methods. 2008;5:943–945. doi: 10.1038/nmeth.1257. [DOI] [PubMed] [Google Scholar]
- 49.Testa I., Wurm C.A., Eggeling C. Multicolor fluorescence nanoscopy in fixed and living cells by exciting conventional fluorophores with a single wavelength. Biophys. J. 2010;99:2686–2694. doi: 10.1016/j.bpj.2010.08.012. [DOI] [PMC free article] [PubMed] [Google Scholar]
- 50.Lalkens B., Testa I., Hell S.W. MRT letter: Nanoscopy of protein colocalization in living cells by STED and GSDIM. Microsc. Res. Tech. 2012;75:1–6. doi: 10.1002/jemt.21026. [DOI] [PubMed] [Google Scholar]
- 51.Lukinavičius G., Umezawa K., Johnsson K. A near-infrared fluorophore for live-cell super-resolution microscopy of cellular proteins. Nat. Chem. 2013;5:132–139. doi: 10.1038/nchem.1546. [DOI] [PubMed] [Google Scholar]
- 52.Sharonov A., Hochstrasser R.M. Wide-field subdiffraction imaging by accumulated binding of diffusing probes. Proc. Natl. Acad. Sci. USA. 2006;103:18911–18916. doi: 10.1073/pnas.0609643104. [DOI] [PMC free article] [PubMed] [Google Scholar]
- 53.Cognet L., Tsyboulski D.A., Weisman R.B. Subdiffraction far-field imaging of luminescent single-walled carbon nanotubes. Nano Lett. 2008;8:749–753. doi: 10.1021/nl0725300. [DOI] [PubMed] [Google Scholar]
- 54.Giannone G., Hosy E., Cognet L. Dynamic super-resolution imaging of endogenous proteins on living cells at ultra-high density. Biophys. J. 2010;99:1303–1310. doi: 10.1016/j.bpj.2010.06.005. [DOI] [PMC free article] [PubMed] [Google Scholar]
- 55.Giannone G., Hosy E., Cognet L. High-content super-resolution imaging of live cell by uPAINT. Methods Mol. Biol. 2013;950:95–110. doi: 10.1007/978-1-62703-137-0_7. [DOI] [PubMed] [Google Scholar]
- 56.Winckler P., Lartigue L., Cognet L. Identification and super-resolution imaging of ligand-activated receptor dimers in live cells. Sci Rep. 2013;3:2387. doi: 10.1038/srep02387. [DOI] [PMC free article] [PubMed] [Google Scholar]
- 57.Nair D., Hosy E., Sibarita J.B. Super-resolution imaging reveals that AMPA receptors inside synapses are dynamically organized in nanodomains regulated by PSD95. J. Neurosci. 2013;33:13204–13224. doi: 10.1523/JNEUROSCI.2381-12.2013. [DOI] [PMC free article] [PubMed] [Google Scholar]
- 58.Ondrus A.E., Lee H.L., Du Bois J. Fluorescent saxitoxins for live cell imaging of single voltage-gated sodium ion channels beyond the optical diffraction limit. Chem. Biol. 2012;19:902–912. doi: 10.1016/j.chembiol.2012.05.021. [DOI] [PMC free article] [PubMed] [Google Scholar]
- 59.Chmyrov A., Keller J., Hell S.W. Nanoscopy with more than 100,000 ‘doughnuts’. Nat. Methods. 2013;10:737–740. doi: 10.1038/nmeth.2556. [DOI] [PubMed] [Google Scholar]
- 60.Rochefort N.L., Konnerth A. Dendritic spines: from structure to in vivo function. EMBO Rep. 2012;13:699–708. doi: 10.1038/embor.2012.102. [DOI] [PMC free article] [PubMed] [Google Scholar]
- 61.Berning S., Willig K.I., Hell S.W. Nanoscopy in a living mouse brain. Science. 2012;335:551. doi: 10.1126/science.1215369. [DOI] [PubMed] [Google Scholar]
- 62.Lauterbach M.A., Keller J., Hell S.W. Comparing video-rate STED nanoscopy and confocal microscopy of living neurons. J Biophotonics. 2010;3:417–424. doi: 10.1002/jbio.201000038. [DOI] [PubMed] [Google Scholar]
- 63.Bobroff N. Position measurement with a resolution and noise-limited instrument. Rev. Sci. Instrum. 1986;57:1152–1157. [Google Scholar]
- 64.Thompson R.E., Larson D.R., Webb W.W. Precise nanometer localization analysis for individual fluorescent probes. Biophys. J. 2002;82:2775–2783. doi: 10.1016/S0006-3495(02)75618-X. [DOI] [PMC free article] [PubMed] [Google Scholar]
- 65.Chenouard N., Smal I., Meijering E. Objective comparison of particle tracking methods. Nat. Methods. 2014;11:281–289. doi: 10.1038/nmeth.2808. [DOI] [PMC free article] [PubMed] [Google Scholar]
- 66.Swulius M.T., Jensen G.J. The helical MreB cytoskeleton in Escherichia coli MC1000/pLE7 is an artifact of the N-Terminal yellow fluorescent protein tag. J. Bacteriol. 2012;194:6382–6386. doi: 10.1128/JB.00505-12. [DOI] [PMC free article] [PubMed] [Google Scholar]
- 67.Stagge F., Mitronova G.Y., Jakobs S. SNAP-, CLIP- and Halo-tag labelling of budding yeast cells. PLoS ONE. 2013;8:e78745. doi: 10.1371/journal.pone.0078745. [DOI] [PMC free article] [PubMed] [Google Scholar]
- 68.Pavani S.R., Thompson M.A., Moerner W.E. Three-dimensional, single-molecule fluorescence imaging beyond the diffraction limit by using a double-helix point spread function. Proc. Natl. Acad. Sci. USA. 2009;106:2995–2999. doi: 10.1073/pnas.0900245106. [DOI] [PMC free article] [PubMed] [Google Scholar]
- 69.Izeddin I., El Beheiry M., Dahan M. PSF shaping using adaptive optics for three-dimensional single-molecule super-resolution imaging and tracking. Opt. Express. 2012;20:4957–4967. doi: 10.1364/OE.20.004957. [DOI] [PubMed] [Google Scholar]
- 70.Juette M.F., Gould T.J., Bewersdorf J. Three-dimensional sub-100 nm resolution fluorescence microscopy of thick samples. Nat. Methods. 2008;5:527–529. doi: 10.1038/nmeth.1211. [DOI] [PubMed] [Google Scholar]
- 71.Xu K., Babcock H.P., Zhuang X. Dual-objective STORM reveals three-dimensional filament organization in the actin cytoskeleton. Nat. Methods. 2012;9:185–188. doi: 10.1038/nmeth.1841. [DOI] [PMC free article] [PubMed] [Google Scholar]
- 72.Chasles F., Dubertret B., Boccara A.C. Full-field optical sectioning and three-dimensional localization of fluorescent particles using focal plane modulation. Opt. Lett. 2006;31:1274–1276. doi: 10.1364/ol.31.001274. [DOI] [PubMed] [Google Scholar]
- 73.Shtengel G., Galbraith J.A., Hess H.F. Interferometric fluorescent super-resolution microscopy resolves 3D cellular ultrastructure. Proc. Natl. Acad. Sci. USA. 2009;106:3125–3130. doi: 10.1073/pnas.0813131106. [DOI] [PMC free article] [PubMed] [Google Scholar]
- 74.Kanchanawong P., Shtengel G., Waterman C.M. Nanoscale architecture of integrin-based cell adhesions. Nature. 2010;468:580–584. doi: 10.1038/nature09621. [DOI] [PMC free article] [PubMed] [Google Scholar]
- 75.Sibarita J.B. Deconvolution microscopy. Adv. Biochem. Eng. Biotechnol. 2005;95:201–243. doi: 10.1007/b102215. [DOI] [PubMed] [Google Scholar]
- 76.Dertinger T., Colyer R., Enderlein J. Fast, background-free, 3D super-resolution optical fluctuation imaging (SOFI) Proc. Natl. Acad. Sci. USA. 2009;106:22287–22292. doi: 10.1073/pnas.0907866106. [DOI] [PMC free article] [PubMed] [Google Scholar]
- 77.Cox S., Rosten E., Heintzmann R. Bayesian localization microscopy reveals nanoscale podosome dynamics. Nat. Methods. 2012;9:195–200. doi: 10.1038/nmeth.1812. [DOI] [PMC free article] [PubMed] [Google Scholar]
- 78.Studer V., Bobin J., Dahan M. Compressive fluorescence microscopy for biological and hyperspectral imaging. Proc. Natl. Acad. Sci. USA. 2012;109:E1679–E1687. doi: 10.1073/pnas.1119511109. [DOI] [PMC free article] [PubMed] [Google Scholar]
- 79.Zhu L., Zhang W., Huang B. Faster STORM using compressed sensing. Nat. Methods. 2012;9:721–723. doi: 10.1038/nmeth.1978. [DOI] [PMC free article] [PubMed] [Google Scholar]
- 80.Zanella R., Zanghirati G., Vicidomini G. Towards real-time image deconvolution: application to confocal and STED microscopy. Sci. Rep. 2013;3:2523. doi: 10.1038/srep02523. [DOI] [PMC free article] [PubMed] [Google Scholar]