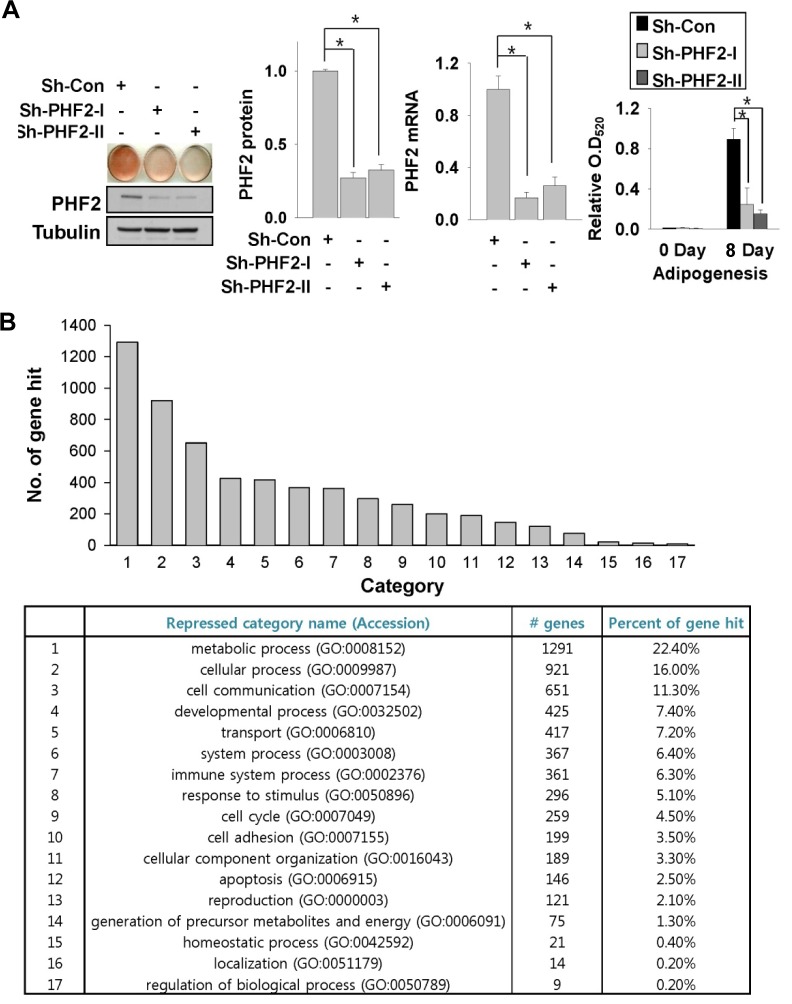
Fig. 1.
PHF2 knock-down reduced the adipogenesis capacity of 3T3-L1 pre-adipocytes. (A) Oil Red-O staining of stable 3T3-L1 cell lines expressing control or PHF2 shRNA. Cell extracts were analyzed with Western blotting using anti-PHF2 and tubulin antibodies (left). PHF2 mRNA and protein levels of indicated stable cell lines were measured before adipogenesis and plotted (middle panels). Oil Red-O dye was extracted with isopropanol and the optical density at 520 nm (O. D520) was measured (left). Bars represents the means ± SDs of three independent experiments, and “*” denotes P < 0.01 versus the control shRNA (sh-con) group. (B) Number of hits for genes involved in cellular pathways showing reduced expression after adipogenesis in the PHF2 knock-down cell line. Genes repressed by more than 0.5-fold compared to the control cell line and had a p-value of less than 0.05 were selected. A total of 4069 genes were analyzed using the DAVID (http://david.abcc.ncifcrf.gov/) database.

