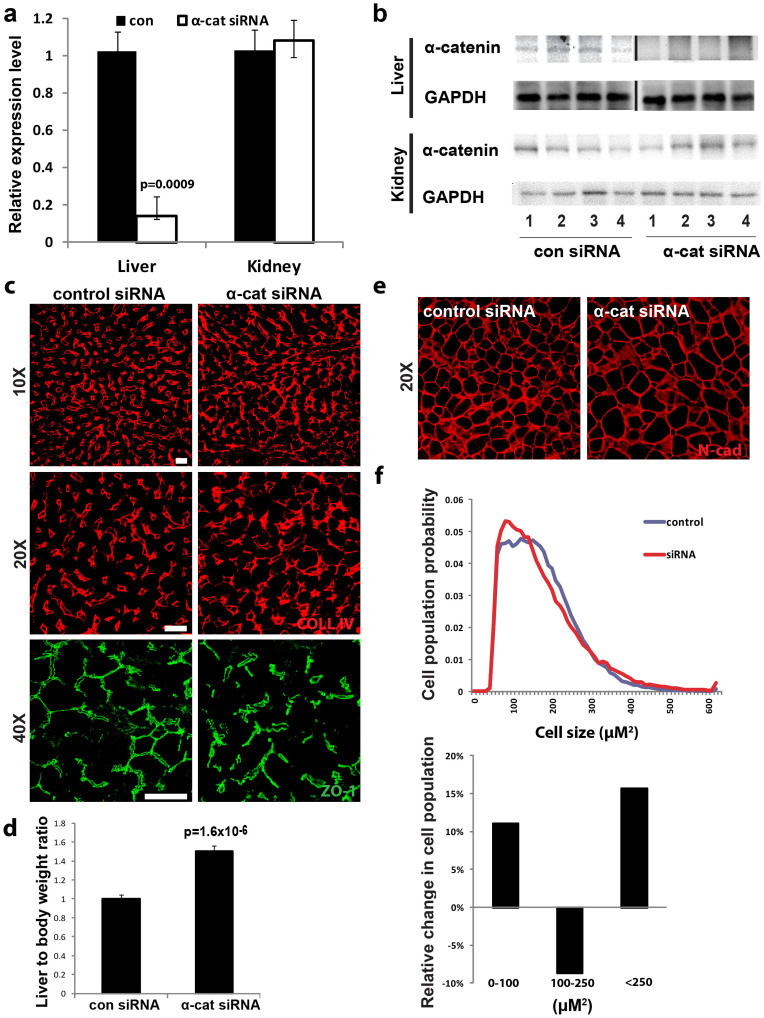
Figure 1. Specific knockdown of α-catenin in liver induces major alterations to the hepatic functional unit.
(A) α-catenin siRNA-nanolipid particle (LNP)-injected mice exhibited a specific knockdown in α-catenin transcript levels (n = 6 for each group) in liver but not in kidney (n = 4 for each group). (B) α-catenin protein levels in liver showed a corresponding decrease (n = 6 for each group). Gel image shown is cropped for concise presentation. (C) Regenerated liver tissues were immunolabelled with antibodies directed against collagen IV (red; 10× and 20×) and zona occludens (ZO)-1 (green; 40× magnification). Sinusoids labelled with collagen IV were tortuous and disorganised in α-catenin siRNA-treated livers. Bile canaliculi immunolabelled with ZO-1 were arranged in an organised network of tubular structures, whereas a disruption in this network was observed in α-catenin siRNA-injected livers. The lumens of the BC were also enlarged. (D) Upon harvesting, the livers were dissected and weighed. The α-catenin siRNA-injected livers were 50% bigger than the control livers. (E) Immunolabelling of cell membranes of liver sections with N-cadherin (red; 20× magnification) revealed that some cells in α-catenin siRNA-injected livers were significantly larger. (F) A statistical analysis of the cell size profile of the experimental livers was performed. Top: The probability distribution graph of the cells was computed and shown. Bottom: The difference between control and α-catenin siRNA cell populations was computed and is represented by the percentage change between the siRNA and control populations. This shows that α-catenin siRNA-injected livers were more highly enriched in the smaller and larger cell fractions as compared with control livers (Control: n = 8, α-cat: n = 11). Scale bars, 50 µm.

