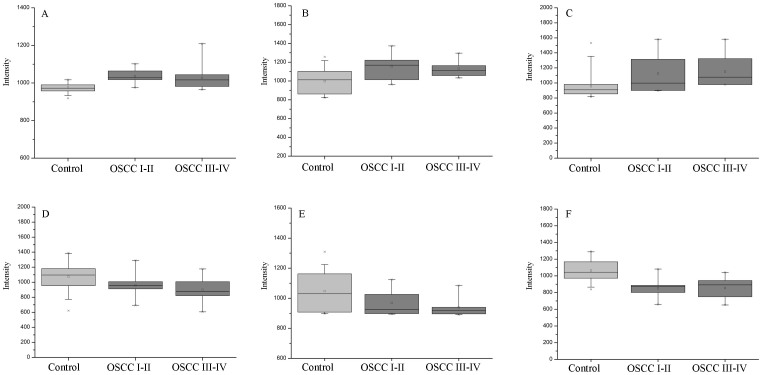
Figure 4. The box plots of six potential biomarkers in distinguishing OSCC patients at stage I–II and III–IV from healthy controls.
(A) propionylcholine, (B) succinic acid, (C) lactic acid, (D) acetylphenylalanine, (E) carnitine, (F) phytosphingosine. Horizontal lines represent from bottom to top: the minimum, 25th, 50th, and 75th percentiles and the maximum.

