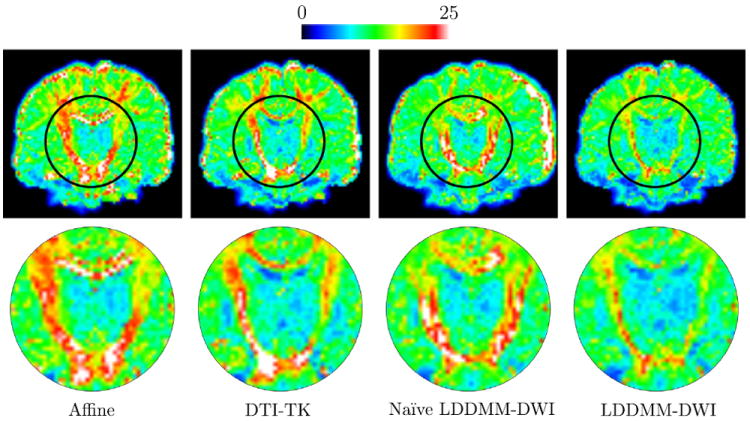
Fig. 1.

The mean RMS error images (top) and the close-ups of regions marked by black circles (bottom). Note that the images were not sliced for left–right symmetry. (For interpretation of the references to color in this figure legend, the reader is referred to the web version of this article.)
