
Figure 1.
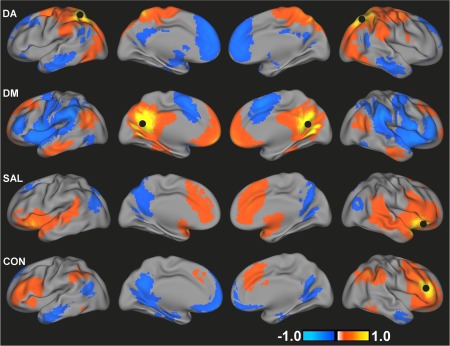
Group mean functional connectivity maps for DA, DM, SAL, and CON for TDC. Black circles indicate the location of seed regions used to generate each map. Images are displayed using a threshold of an absolute value of r > 0.1. [Color figure can be viewed in the online issue, which is available at http://wileyonlinelibrary.com.]