
Figure 2.
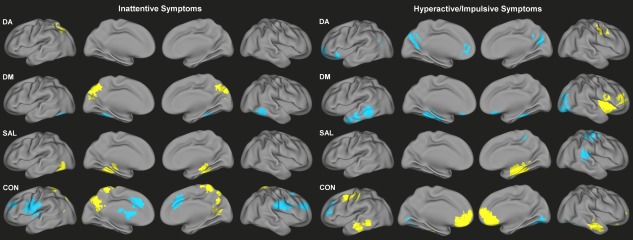
Congruent functional connectivity‐behavior relationships across TDC and ADHD for inattention scores (left) and hyperactivity/impulsivity scores (right) for DA, DM, SAL, and CON. Yellow indicates positive associations with symptoms; blue indicates negative associations with symptoms. [Color figure can be viewed in the online issue, which is available at http://wileyonlinelibrary.com.]