
Figure 5.
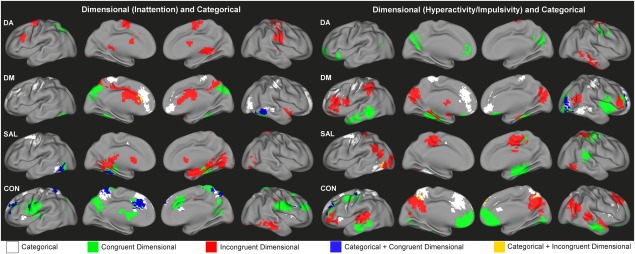
Composite maps showing the regional connectivity alterations associated with categorical effects of ADHD diagnosis (categorical, white), dimensional effects of inattention (left) or hyperactivity/impulsivity (right) (congruent dimensional, green), the interaction of categorical and dimensional effects (incongruent dimensional, red), the overlap of categorical and congruent dimensional effects (blue) and the overlap of categorical and incongruent dimensional effects (yellow) for DA, DM, SAL, and CON. [Color figure can be viewed in the online issue, which is available at http://wileyonlinelibrary.com.]