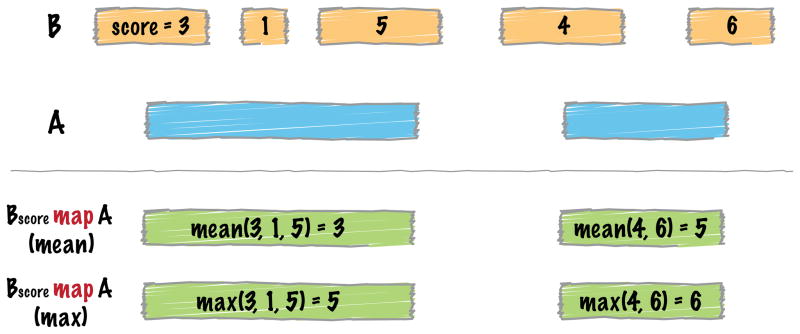
Figure 5. Schematic of the BEDTools map tool’s functionality.
The map tool summarizes the overlaps observed between two interval files, A and B. The result is a summary of all intervals in B that overlapped each interval in A. The summary is computed based on operations such as mean or max, which compute the average or maximum value for a given column from all of the intersecting B intervals.

