Figure 2.

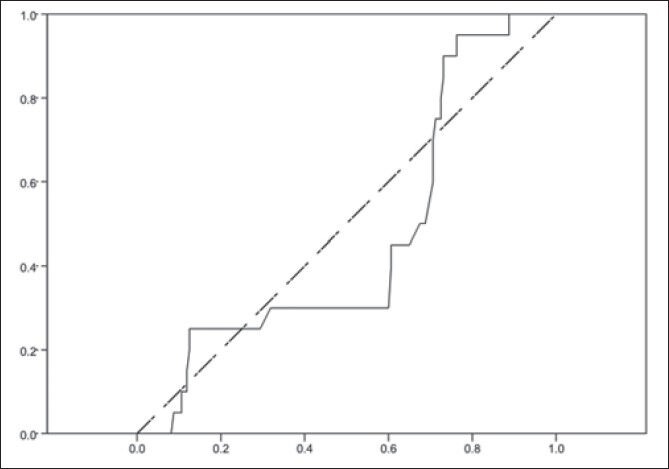
Receiver operating characteristic curve for Hounsfield density of calcium phosphate. Vertical axis is sensitivity and horizontal axis is (1-specifisity). Source of the curve: Reference line is dot-line

Receiver operating characteristic curve for Hounsfield density of calcium phosphate. Vertical axis is sensitivity and horizontal axis is (1-specifisity). Source of the curve: Reference line is dot-line