Figure 2.
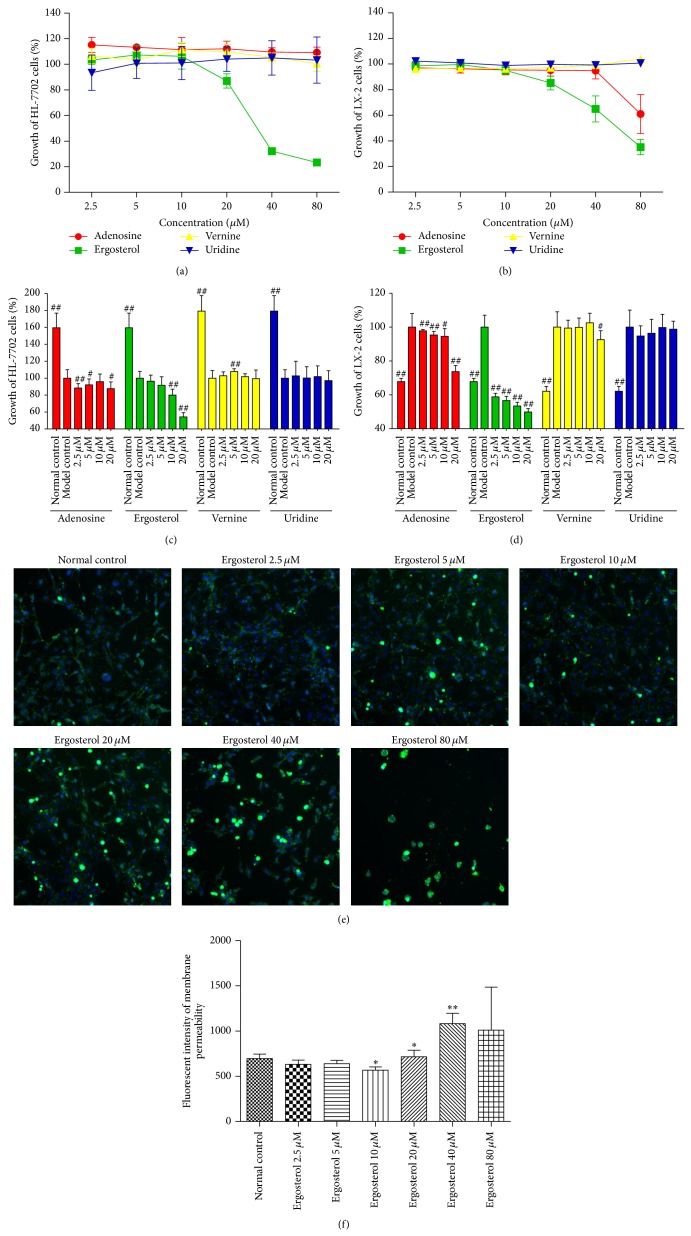
Cytotoxicity and proliferation of adenosine, ergosterol, vernine, and uridine in HL-7702 and LX-2 cell lines. ((a) and (b)) Cells were cultured in a 96-well plate at a density of 4,000 cells/well and incubated with 2.5–80 μM of adenosine, ergosterol, vernine, and uridine for 24 h, respectively. For HL-7702 cell, cytotoxicity was detected by CCK8. For LX-2 cell, cytotoxicity was analyzed by MTT. Representative dose-response curves in HL-7702 cell (a) and LX-2 cell (b) culture with adenosine, ergosterol, vernine, and uridine for 24 h were represented by line chart, respectively. ((c) and (d)) Cells were cultured in a 96-well plate at a density of 4,000 cells/well. HL-7702 cells were exposed with 0.5 mM H2O2 for 30 min and LX-2 cells were incubated with 0.5 ng/mL TGF-β1 for 24 h. The following cells were cultured with 2.5–20 μM adenosine, ergosterol, vernine, and uridine for 24 h, respectively. For HL-7702 cell, proliferation was detected by CCK8. For LX-2 cell, proliferation was analyzed by MTT. Representative dose-response curves in HL-7702 cell (c) and LX-2 cell (d) were represented in comparison with the Model control (100%) and were shown as growth of the cells, respectively. (e) LX-2 cells were cultured in a 96-well plate at a density of 4,000 cells/well. Cells were incubated with 2.5–80 μM of ergosterol for 24 h. Images of permeability of the lysosomal membrane were investigated by Cellomics ArrayScan VTI HCS Reader. The nuclear and lesioned lysosomal membranes were stained with blue and green, respectively. (f) The image analysis of immunofluorescence used by Cellomics Cell Health Profiling BioApplication Software. * P < 0.05, ** P < 0.01, versus Normal control. # P < 0.05, ## P < 0.01, versus Model control.

