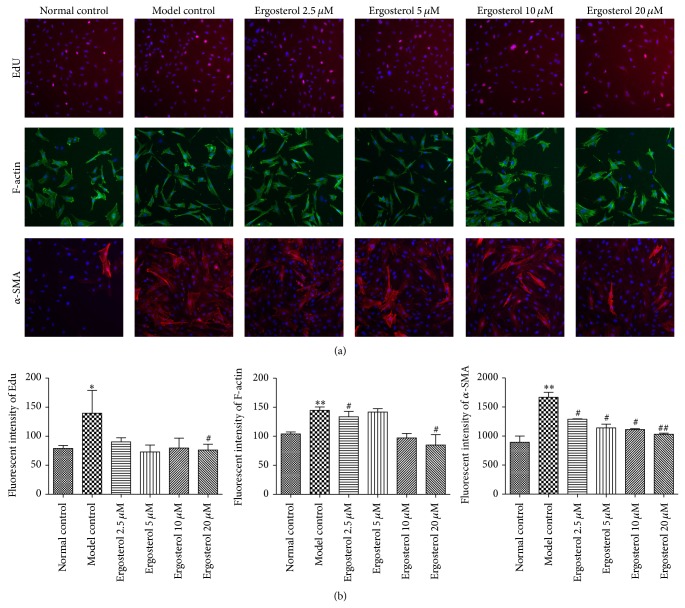
Figure 3.
Effects of ergosterol on expressions of EdU, F-actin, and α-SMA induced by TGF-β1 in LX-2 cell. (a) LX-2 cells were cultured in a 96-well plate at a density of 4,000 cells/well. Cells were stimulated by 5 ng/mL TGF-β1 for 24 h and then incubated with 2.5–20 μM of ergosterol for 24 h. Images of EdU, F-actin, and α-SMA were investigated by Cellomics ArrayScan VTI HCS Reader, respectively. The nuclear and proliferating cells were stained with blue and pink, respectively. (b) The image analysis of immunofluorescence used by Cellomics Cell Health Profiling Bio Application Software. * P < 0.05, ** P < 0.01, versus Normal control; # P < 0.05, ## P < 0.05, versus Model control.

