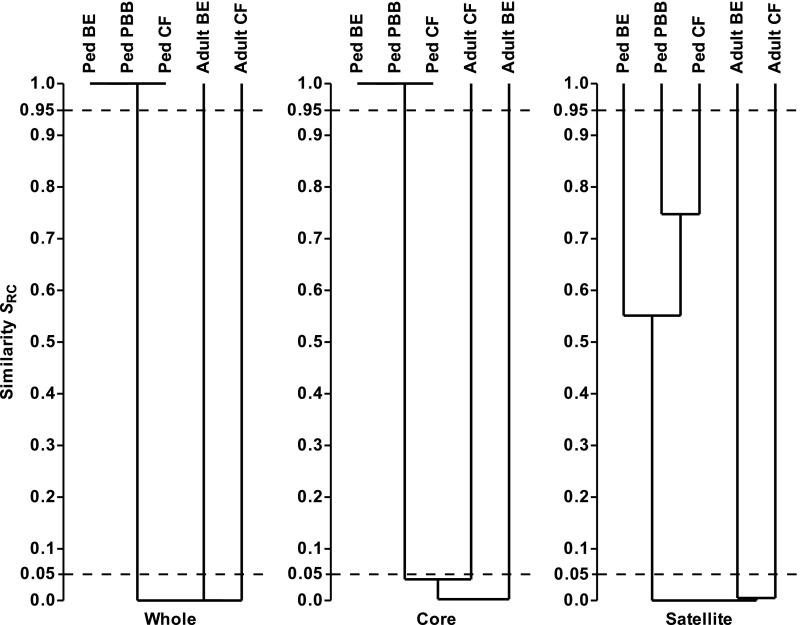
Figure 5.
Dendrograms of Raup and Crick probability-based similarity index (SRC) between the pediatric bronchiectasis (BE), protracted bacterial bronchitis (PBB), and cystic fibrosis (CF) bacterial metacommunities and compared with adult CF and BE metacommunities. Given are the whole, core, and satellite microbiota. SRC < 0.95 and SRC > 0.05 denote similarity no greater than expected by chance. SRC < 0.05 denotes significant dissimilarity, and SRC > 0.95 significant similarity. The 0.05 and 0.95 thresholds are depicted with dashed lines in each instance. Dendrograms were constructed using unweighted pair-group method using arithmetic mean (UPGMA).

