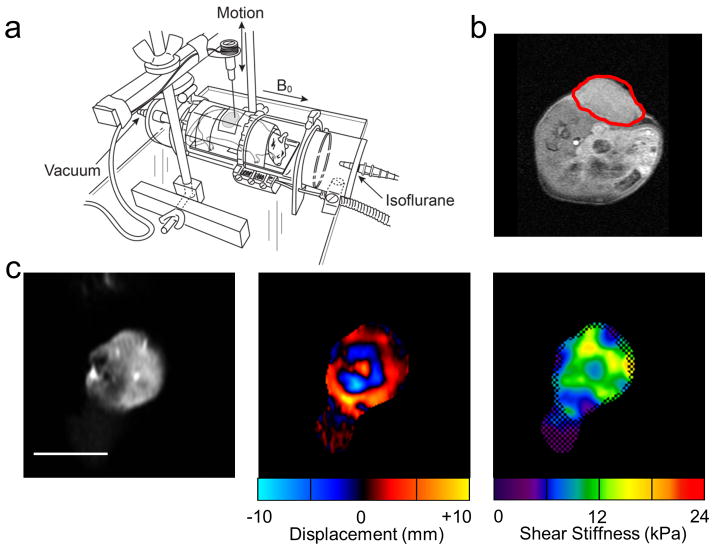
Figure 1.
Experimental setup and example data. (a) Experimental setup consisting of an enclosed RF transmit/receive coil placed inside the MR scanner. (b) Axial slice through the mouse at the level of the flank. The tumor is outlined in red. An MR-compatible needle, attached to an electromechanical driver, was inserted into the tumor (c) Example magnitude image of a coronal slice through the tumor with corresponding wave data and reconstructed elastogram. The white line represents 1 cm. In the elastogram, the checkerboard pattern indicates regions of poor wave signal-to-noise ratio that were excluded from the stiffness measurement.

