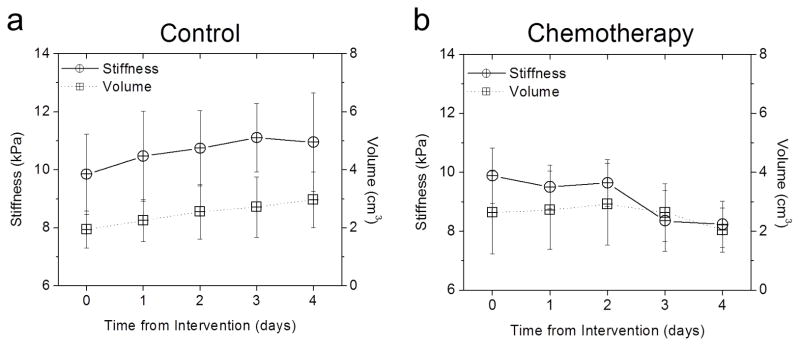
Figure 3.

Comparison of stiffness and volume change with treatment. (a) Tumor stiffness (solid line, circle) and volume (dotted line, squares) versus time in a control tumor (n = 8). No statistically significant change from baseline in either the stiffness or volume measurements. (b) Tumor stiffness (solid line, circle) and volume (dotted line, squares) versus time in a chemotherapy treated tumor (n = 8). Change in tumor stiffness from baseline was statistically significant at day 3 and 4, but no significant change in volume.
