Figure 4.
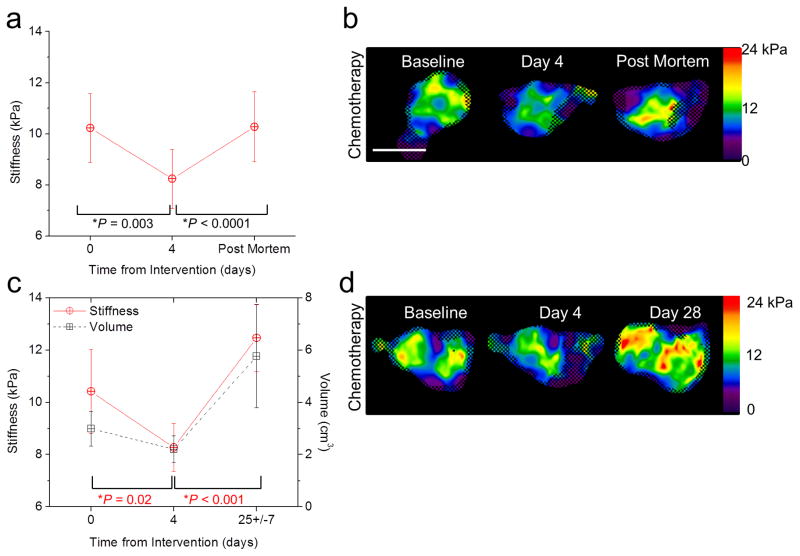
Change in stiffness as an indicator of tumor viability. (a) Stiffness versus time in chemotherapy-treated tumors at baseline, day 4 post-treatment, and post mortem. Error bars represent the 95% confidence interval and statistical significance was determined by comparison to the previous time point using a repeated-difference ANOVA (n = 10). (b) Elastograms (stiffness maps in units of kPa) of mouse tumors at baseline, day 4 post-treatment, and post mortem. Color bars represent stiffness in units of kPa. The checkerboard pattern indicates regions that were excluded from measurement due to poor SNR. The white scale bar represents 1 cm. (c) Evaluation of tumor stiffness at baseline, day 4 post-treatment, and after tumor regrowth (day 25±7). P values in red report the statistical significance for stiffness change. Error bars represent the 95% confidence interval and statistical significance was determined by comparison to the previous time point using a repeated-difference ANOVA (n = 9). (d) Elastograms (stiffness maps in units of kPa) of mouse tumors acquired at each time point. The checkerboard pattern indicates regions that were excluded from measurement due to poor SNR. The white scale bar represents 1 cm.

