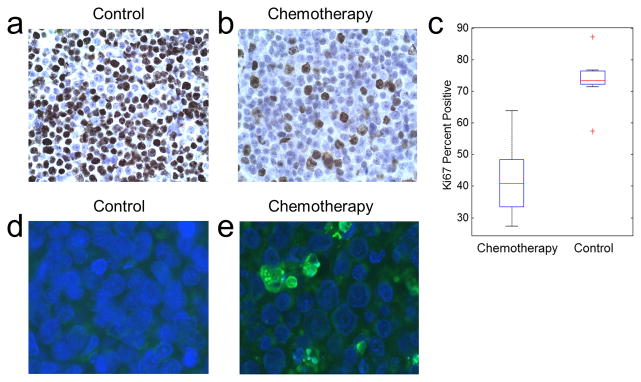
Figure 5.

Cellular differences between the treatment groups. (a–b) Ki67 staining to measure levels of active cellular proliferation in a control (a) and a chemotherapy-treated (b) mouse tumor. (c) Ki67 percent positive for active cellular proliferation versus treatment type. Chemotherapy-treated tumors have decreased levels of active proliferation compared to the control tumors (P < 0.001). The central mark is the median, edges are the 25th and 75th percentiles, and the outliers are indicated by +. (d–e) TUNEL staining to assess apoptosis in a control and a chemotherapy-treated mouse tumor.
