
Figure 1.
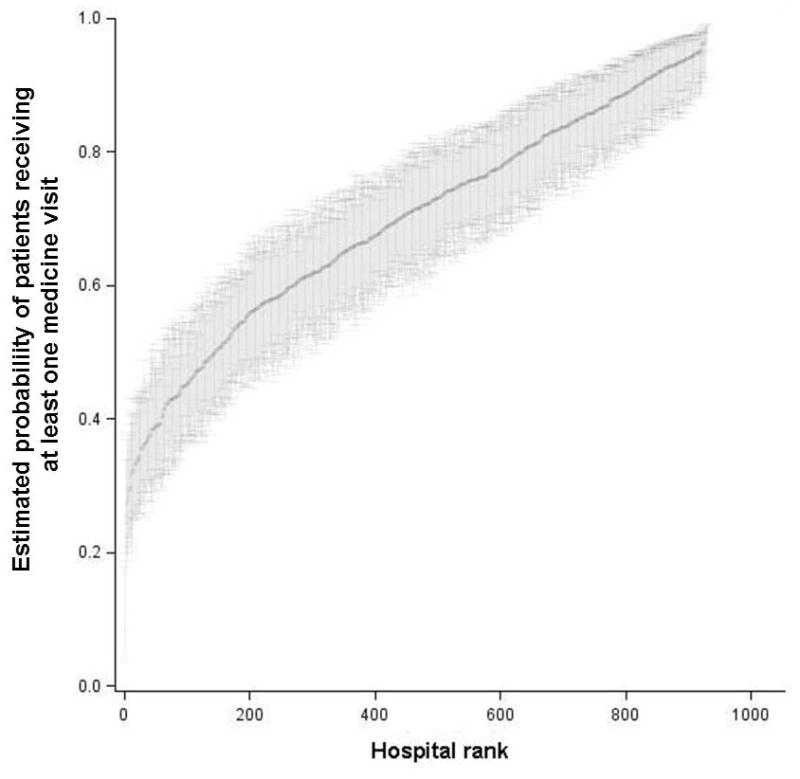
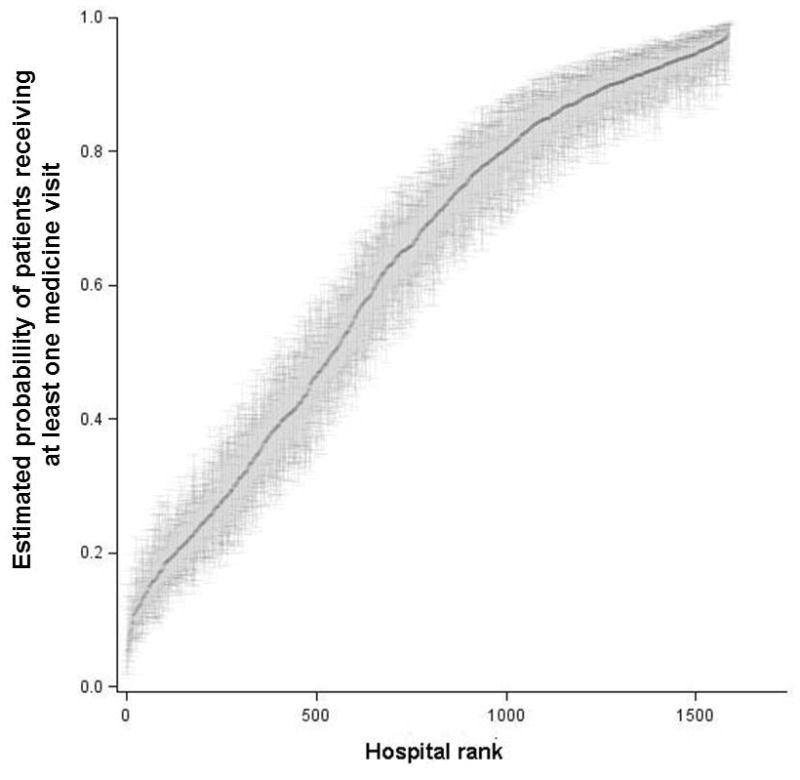
Figure 1A. Hospital-level Probability of Colectomy Patients Receiving at Least One Medicine Visit
Hospitals are ranked along the x-axis according to their estimated probability of having at least one medicine visit for colectomy patients. Each point of the black line represents the estimated probability for one hospital. The gray area above and below each point represents the 95% confidence interval around the estimate for each hospital.
Figure 1B. Hospital-level Probability of Total Hip Replacement Patients Receiving at Least One Medicine Visit
Hospitals are ranked along the x-axis according to their estimated probability of having at least one medicine visit for total hip replacement patients. Each point of the black line represents the estimated probability for one hospital. The gray area above and below each point represents the 95% confidence interval around the estimate for each hospital.