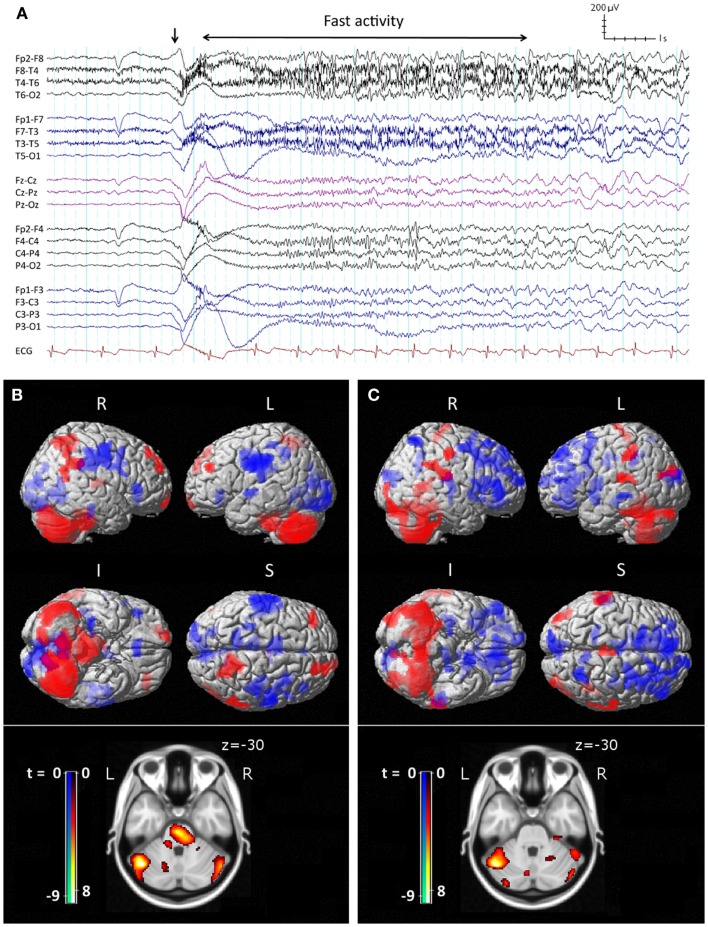
Figure 1.
Ictal EEG features and peri-ictal SPECT of tonic seizures in LGS. (A) Clinical onset of seizure corresponds with a high-voltage slow transient (vertical arrow) followed by apparent diffuse attenuation, evolving into low-voltage fast activity (LVFA) and later a run of slow spike-and-wave mixed with notched delta. (B) Early radiotracer injection (<10 s after offset of LVFA) and subsequent SPECT shows an early pattern of increased (red) cerebral blood flow in frontal and parietal “attention” areas, pons, and cerebellum, and decreased (blue) CBF in primary cortical areas. (C) Late radiotracer injection (>10 s after offset of LVFA) and subsequent SPECT shows an evolution toward a pattern of increased CBF over lateral parietal cortex and cerebellum, and decreased CBF bi-frontally, while the pons is no longer involved. (B,C) Top: surface renderings displayed at p < 0.02 (uncorrected), extent k > 125 voxels. Below: overlay onto axial slice of MNI T1 152 average brain displayed at p < 0.05 [cluster-corrected for family-wise error (FWE)]. R = right, L = left, I = inferior, S = superior. Adapted and re-printed with permission from Intusoma and colleagues (13).

