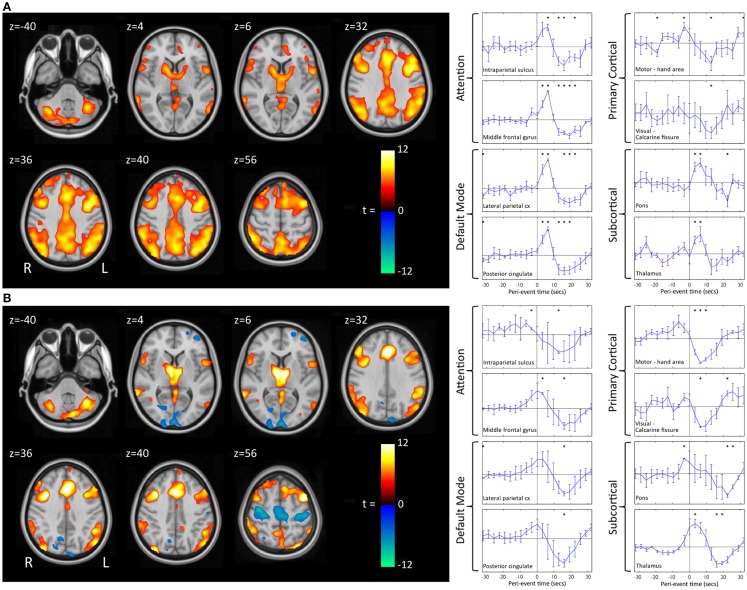
Figure 5.
Group-level EEG–fMRI activation maps and peri-event BOLD signal time-courses in LGS patients with epileptogenic lesions in different cortical locations are shown. (A) Generalized paroxysmal fast activity (GPFA). Left: fixed-effects whole-brain group EEG–fMRI analysis in six patients with cortical lesions in different locations showing co-activation of two normally anti-correlated cognitive systems in diffuse association cortex: the attention and default-mode networks. Activations are displayed as two-tailed t-statistics thresholded at p < 0.05 (corrected for FWE) and overlaid on axial slices of the MNI T1 152 average brain. Right: random-effects peri-event time-course analysis showing GPFA group mean BOLD signal change from regions of interest. Time-courses are displayed in 3.2 s time-bins, from 32 s before to 32 s after event onset (indicated by vertical line). Error bars indicate standard errors. Asterisks indicate time-bins of significant mean BOLD signal change (two-tailed single sample t-tests, p < 0.05, uncorrected). Time-course analysis confirms simultaneous BOLD signal increases in frontal and parietal association cortical areas, thalamus, and pons, and reduced signal in primary cortical areas. (B) Slow spike-and-wave (SSW). Left: fixed-effects whole-brain group EEG–fMRI analysis in three subjects with cortical lesions in different locations showing mixed increased and decreased BOLD signal, including activation in thalamus and lateral frontal and parietal areas, and deactivation in primary cortex including pericentral and occipital regions. Activations are displayed as per (A). Right: random-effects peri-event time-course analysis showing SSW group mean BOLD signal change from regions of interest, as displayed in (A). Time-course analysis shows a complex set of activity changes that are only partially captured by the whole-brain maps. Attention and default-mode networks are being driven simultaneously, but with a steady “pre-spike” increase in activity followed by a decrease in signal at the time of scalp-detected SSW. Primary cortical regions show signal decreases. Adapted and re-printed with permission from Archer and colleagues (29).

