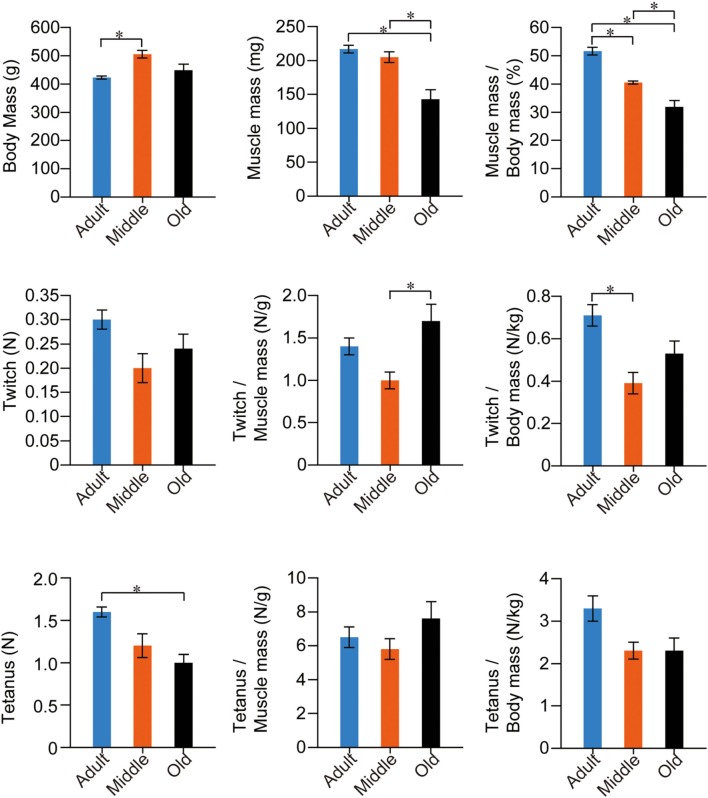
Figure 6.
Stats for SOL muscle functions in the three groups. Muscle twitches and tetanus are expressed in terms of Newtons (N), and are evaluated as absolute and relative (per muscle and body mass) values. Overall significant differences among the three groups were apparently lower in slow-type SOL when compared with fast-type PLT muscles (see previous Figure 5), thus suggesting that functional decreases were more apparent in fast-type muscle with aging. *p < 0.05

