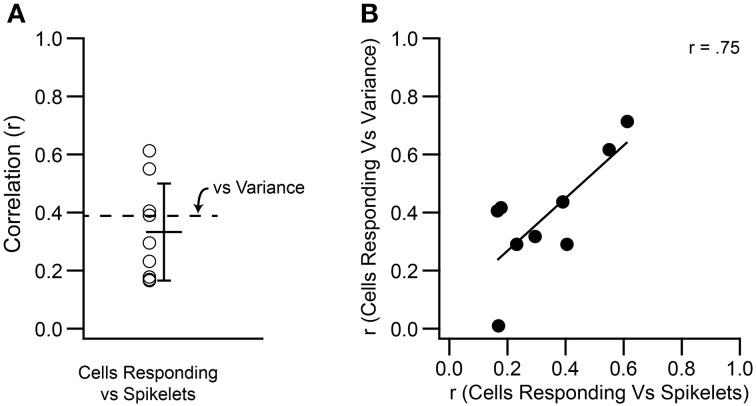
Figure 11.
Variance and spikelet number are correlated to the number of PCs showing climbing fiber reflex evoked CSs. (A) Each circle shows, for a PC, the r value for the correlation between number of spikelets in an evoked CS and number of cells showing a reflex response to the same stimulus. Mean and SD are shown. The mean r value for the correlation between T window variance and number of responding cells is replotted from Figure 4 for comparison (dashed line). (B) Scatter plot showing the correspondence between the r values for correlation of variance and spikelets with the number of PCs responding to a stimulus.

