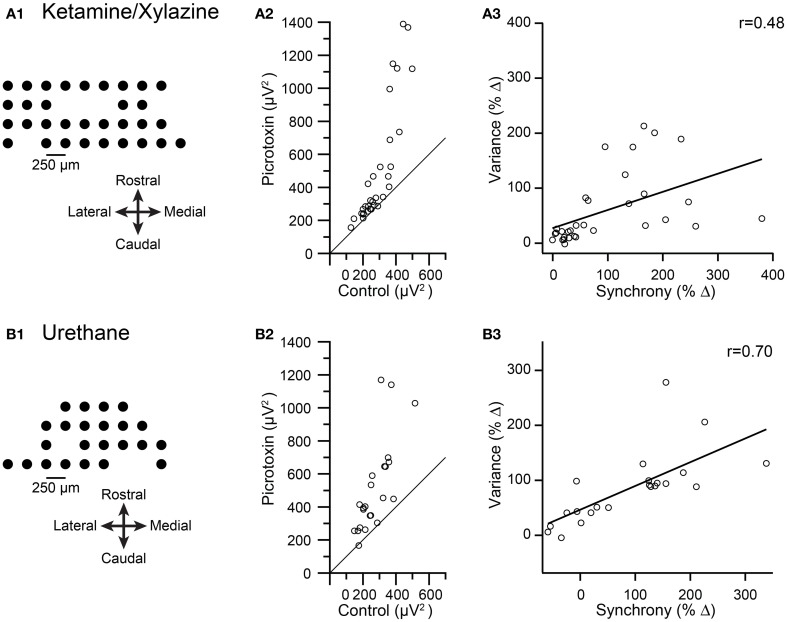
Figure 6.
Pharmacologically-induced increases in CS synchrony also increase spikelet-related variance. Results from recordings made under ketamine/xylazine (A) and urethane (B) are shown. (A1,B1) Schematics showing recording arrays. (A2,B2) Plot of average spikelet-related variance in control (x-axis) vs. following an injection of picrotoxin into the IO (y-axis). Each circle represents the data from one PC in the array. Diagonal line in each plot is the line y = x. (A3,B3) Plots of percent change in variance between control and picrotoxin conditions vs. the percent change in synchrony between these conditions for each PC. Regression lines are plotted and r values are indicated.

