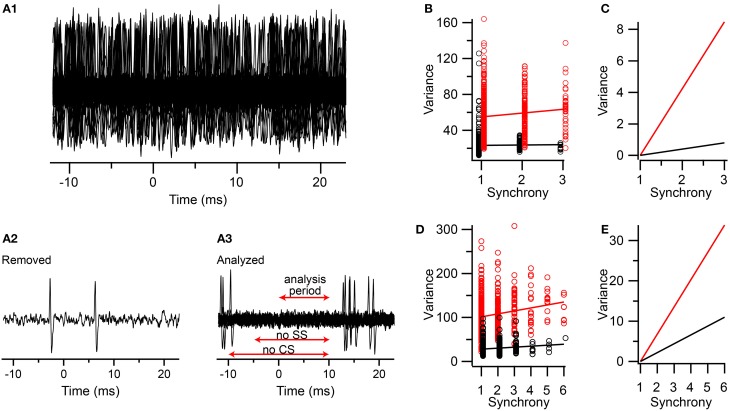
Figure 8.
Comparison of contributions of spikelets and fields from neighboring neurons to the correlation of synchrony and spikelet-related variance. (A1) Segments of an extracellular recording from a PC all aligned to the times of the CSs in other PCs in a group of PCs whose CSs are synchronized. (A2) Example of one trace that was removed from set shown in (A1) because of simple spikes being present just before and during the analysis period (A3) The set of traces selected from those in (A1) in which no CSs or simple spikes were present during the time windows indicated (SS = simple spikes). (B) Plot of variance vs. CS synchrony among PCs in the group. Variance measurements during the 0–10 ms period in the traces with no spikes indicated by black circles. T window variance for the CSs for the PC whose traces were analyzed for fields indicated by red circles. (C) Replotting of regression lines shown in (B) after vertically aligning their left-most points. (D,E) Same as (B,C) respectively, but for a second experiment. Data markers in (B,D) are slightly offset along the x-axis for clarity.

