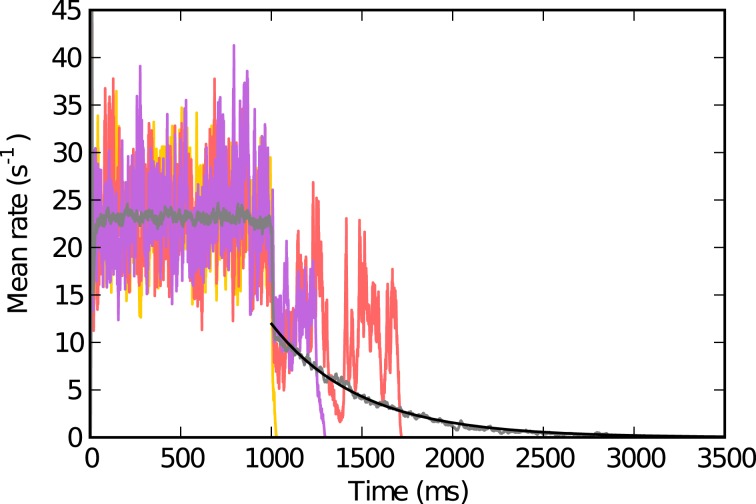
Figure 1.
Population activity in single trials and trial averaged activity. The individual colored traces (red, yellow, purple) show the population activity while the neurons receive external excitatory input for t ∈ [tstim,on, tstim,off] (here tstim,on = 0 and tstim,off = 1000 ms) and after (t > tstim,off) for g = 4.4, J = 1.1 mV. The trial averaged population activity (averaged over 100 simulations with the same parameters) is depicted in gray. The black curve shows an exponential fit with estimated exponential constant T = 487 ms that we define as the lifetime (see text). Other parameters: N = 125 000, ϵ = 0.01, Vthr = 20 mV, Vres = 0 mV, Rm = 80 MΩ, τm = 20 ms, τsyn = 0.5 ms, τref = 2 ms, d = 1.5 ms.

