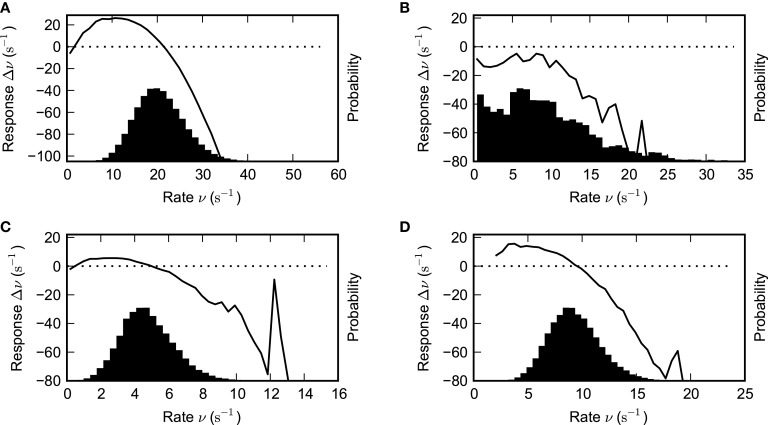
Figure 10.
Estimated network response function and population rate distribution. The black solid lines depict the estimated network response functions, i.e., the local derivative of the firing rate function for various parameter combinations. It was estimated by computing the difference of input rate and output rate after a delay of δt = 1.5 ms (see text for details). The histograms quantify the amount of time spent at a given rate. Parameter values: (A) g = 4.2, J = 1.1 mV (B) g = 4.2, J = 0.8 mV (C) g = 5.2, J = 1.8 mV (D) g = 4.8, J = 1.8 mV. Other parameters as in Figure 1.

