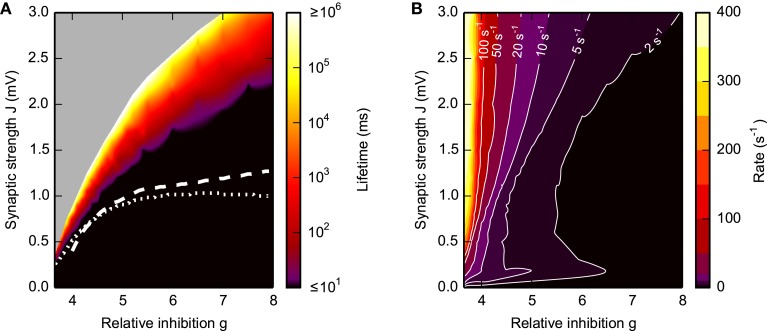
Figure 3.
Lifetime (A) and firing rate (B) of SSAI. Dependence of the SSAI lifetime (A) and mean firing rate (B) [cf. Equation (7)] on the synaptic weight J and the relative strength g of inhibition. Lifetimes and mean firing rates were measured after the external input was turned off. Data represent averages over 10 network realizations. White curves in (A) mark saddle-node bifurcations obtained from the diffusion approximation of the LIF neuron [see Brunel, 2000 and Equation S1 in the Supplementary Material with input current mean and variance derived from Equation (17); dotted curve] and from the Abeles-type two-state model (19) (dashed; with rmax = 1/2τref, see Section 3.4.1). Other parameters as in Figure 1.

