Figure 1.
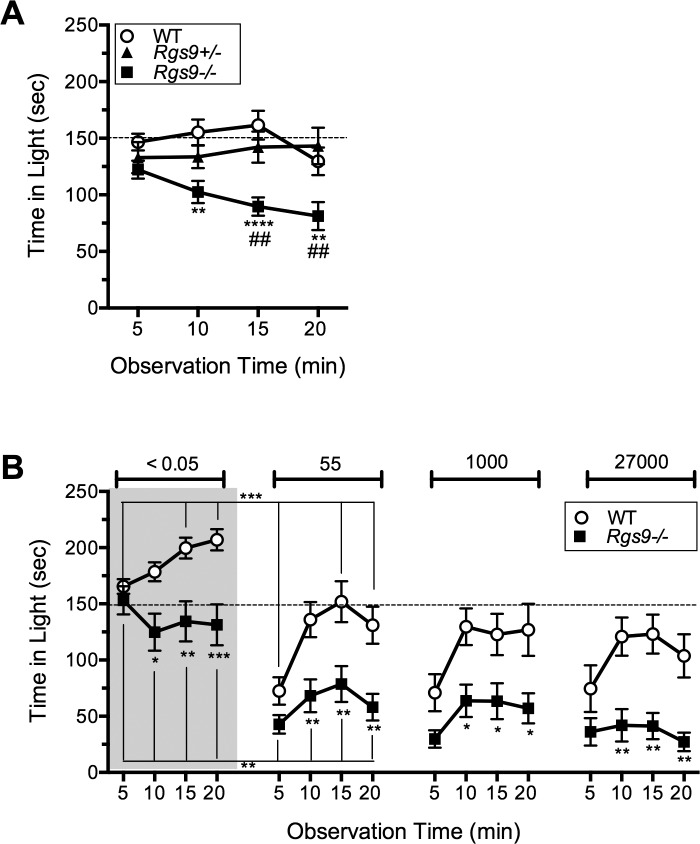
Light aversion behavior in Rgs9−/− mice. (A) Time spent in the light by naïve mice upon exposure to 27,000 lux. The time was calculated over 5-minute intervals following placement of the mouse in the light-dark box. The mean ± SEM of each 5-minute interval is shown for wild-type (C57BL/6J; n = 12; circles), Rgs9+/− (n = 11; triangles), and Rgs9−/− (n = 11; squares). Overall effect of genotype (F(2,124) = 20.27; P < 0.0001); Rgs9−/− versus wild-type, **P < 0.01, ****P < 0.0001; Rgs9−/− versus Rgs9+/−, ##P < 0.01. (B) Effect of previous exposure on time spent in the light by mice sequentially exposed to the indicated light levels of <0.05, 55, 1000, and 27,000 lux. Each exposure was separated by at least 3 days. Mean ± SEM of each 5-minute interval is shown for wild-type (n = 11; circles) and Rgs9−/− (n = 12; squares). Overall effects of genotype F(1,21) = 9.21; P = 0.0063 at <0.05 lux; F(1,21) = 11.04; P = 0.0032 at 55 lux; F(1,21) = 8.84; P = 0.0073 at 1000 lux; and F(1,21) = 13.38; P = 0.0015 at 27,000 lux. Rgs9−/− versus wild-type: *P < 0.05; **P < 0.01; ***P < 0.001. Brackets marked with symbols indicate significant differences between light intensities. For both panels, a dashed line indicates 50% time in the light.

