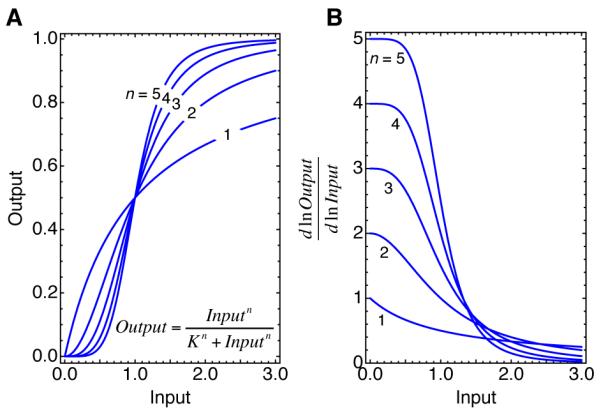
Fig 2. Ultrasensitivity and the Hill function.

(A) Input-output relationships for Hill functions with exponents of 1, 2, 3, 4, and 5. When n = 1 the response is the same as a Michaelian response. When n > 1, the response is ultrasensitive, and the greater the value of n, the more switch-like the response. (B) Local sensitivities, as measured by the function , for Hill curves with exponents of 1, 2, 3, 4, and 5. Note that the local sensitivity is the same as the polynomial order of the curve, and at low values of Input the sensitivity approaches n.
