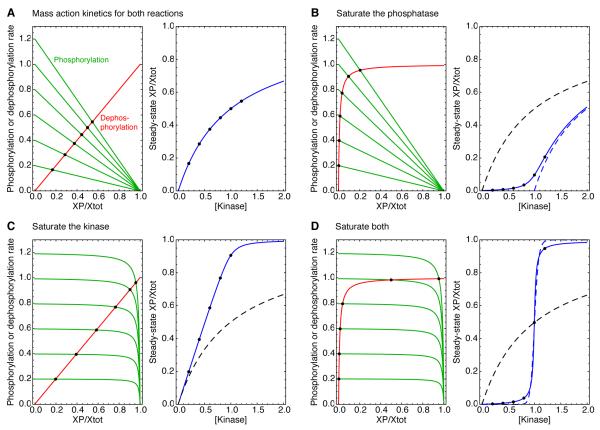
Fig 3. Michaelian responses and zero-order ultrasensitivity: rate-balance analysis.
(A) Rate balance analysis assuming mass action kinetics, which yield a Michaelian response. (B-D) Rate balance analysis assuming that one or both of the reactions is running close to saturation. In each panel, the left-hand plot shows the rate curves, with the phosphorylation rates shown in green and the dephosphorylation rates shown in red. The intersection points (solid black circles) correspond to steady states. The right-hand plots show the input ([kinase]) vs. output (the fraction of Xtot phosphorylated at steady-state) relationships in solid blue, as described by Eqs 2.3-2.5. The solid black circles are the same steady states shown in the left-hand plots. The dashed black curves in panels B-D show Michaelian input-output relationships, for comparison, and the dashed blue curve in panel B shows a Michaelian input-output curve shifted one concentration unit to the right. The assumed kinetic parameters were: k1 = k−1 = Xtot = p’ase =1; Km1 = Km2 = 0.01; and kinase = 0.2, 0.4, 0.6, 0.8, 1.0, or 1.2. The effective Hill coefficients for the blue curves were 1, 1.18, 2, and 26.1, respectively. The dashed blue line in panel D shows a Hill function with a Hill exponent of 26.1 for comparison. Similar input-output curves can be found in [19].

