
Fig. 2.
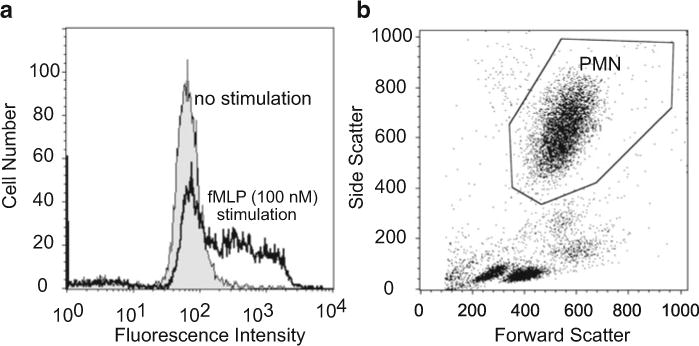
Oxidative burst measurement with flow cytometry using DHR. (a) Fluorescence histogram profiles of the oxidative metabolic response of PMN stimulated with 100 nM fMLP (open curve) or of unstimulated PMN (shaded curve). An example of the histograms 10 min after stimulation is shown. (b) Gating of PMN using forward and side scatter plot of lysed human whole blood.