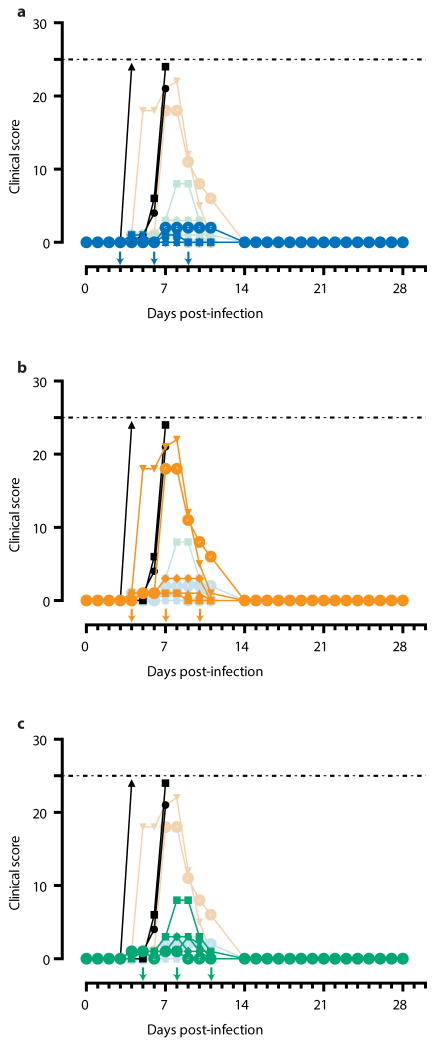
Extended Data Figure 1. Clinical scores for each ZMapp™-treated group.
Arrows indicate treatment days. Dashed line represents humane endpoint threshold. Faded symbols/lines are the other two treatment groups, for comparison. Control group (Group G) is shown in black on all three panels. (a) Clinical score of Group D (blue); (b) Clinical score of Group E (orange); (c) Clinical score of Group F (green).

