. 2014 Oct 10;105(14):143704. doi: 10.1063/1.4898040

FIG. 3.

FIG. 3.

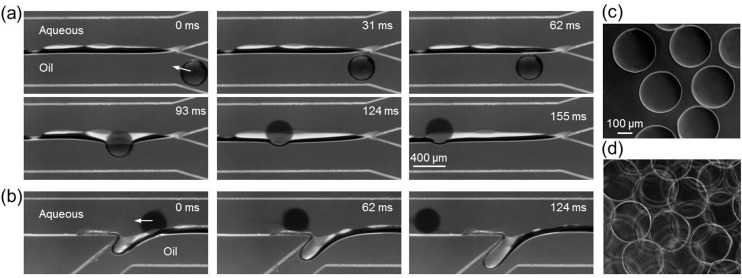
Extraction and collection of hydrogel microparticles. (a) Typical time-lapse images (top view) showing migration of hydrogel microparticles from carrier oil emulsion into aqueous extracting solution. (b) Typical time-lapse images (top view) of hydrogel microparticles exiting from the bifurcated outlet. (c) A typical image of the hydrogel microparticles collected in the aqueous solution from on-chip extraction. (d) A typical image of the hydrogel microparticles obtained by off-chip approach showing aggregation. The flow rates of alginate solution, carrier oil emulsion, and aqueous extracting solution are 0.1, 5.5, and 5.5 ml/h, respectively. The scale bar in (a) and (c) also applies to (b) and (d), respectively. (Multimedia view) [URL: http://dx.doi.org/10.1063/1.4898040.2] Download video file (233.7KB, mov) DOI: 10.1063/1.4898040.2 [URL: http://dx.doi.org/10.1063/1.4898040.3] Download video file (293.1KB, mov) DOI: 10.1063/1.4898040.3