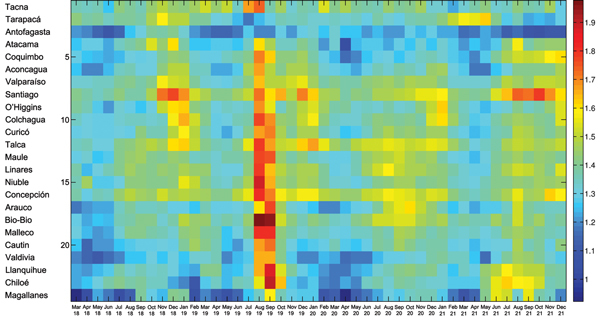
Figure 2.

Temporal evolution (March 1918–December 1921) of all-cause mortality rates during the 1918 influenza pandemic across 24 provinces of Chile, sorted in geographic order from northern to southern Chile. For visualization purposes, the time series are log transformed.
