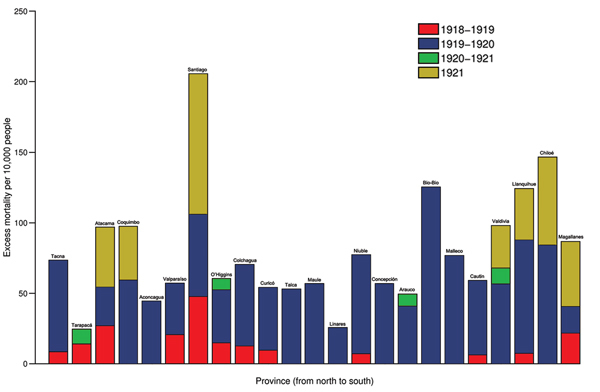
Figure 3.

Excess deaths per 10,000 population across 24 provinces of Chile according to pandemic periods (July 1918–March 1919, June 1919–March 1920, November 1920–March 1921, and June 1921–December 1921) in geographic order from northern to southern Chile. Excess deaths are above the upper limit of the baseline mortality curve calibrated by using all-cause monthly deaths before the 1918 influenza pandemic.
