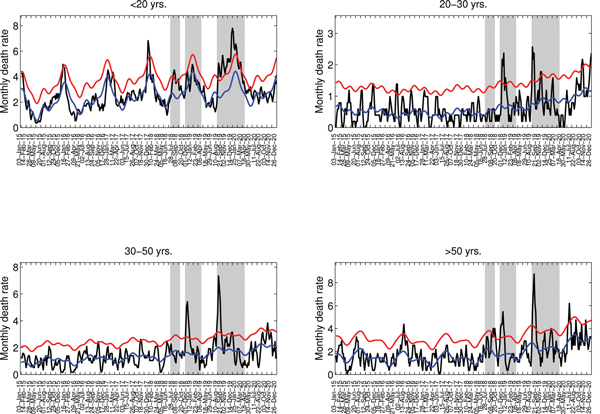
Figure 6.

Age-stratified weekly respiratory mortality rates in Concepción, Chile, 1915–1920 (black lines). A) <20 years; B) 20–29 years; C) 30–50 years; D) >50 years. Shaded areas highlight 3 periods of excess deaths associated with 3 waves of the pandemic occurring in July–September 1918, November 1918–March 1919, and August 1919–March 1920. The Serfling seasonal regression model baseline (blue lines) and corresponding upper limit of the 95% confidence interval of the baseline (red lines) are also shown. Excess deaths are estimated as the number of deaths occurring above the upper limit of the baseline mortality curve, which was calibrated by using number of deaths before the 1918 influenza pandemic.
