Figure.

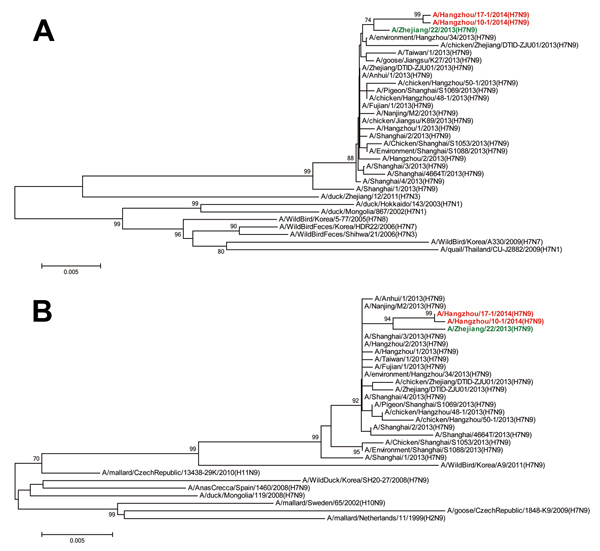
Phylogenetic analyses of hemagglutinin (A) and neuraminidase (B) of influenza A(H7N9) viruses. The trees were constructed by using the neighbor-joining method with bootstrap analysis (n = 1,000) in the MEGA5.0 program (4). Red indicates the 2 viruses isolated from co-infected patients in Hangzhou, China, and green indicates the first strain isolated during the second wave of the influenza A(H7N9) outbreak in China, which started in October 2013. Scale bars indicate nucleotide substitutions per site.
