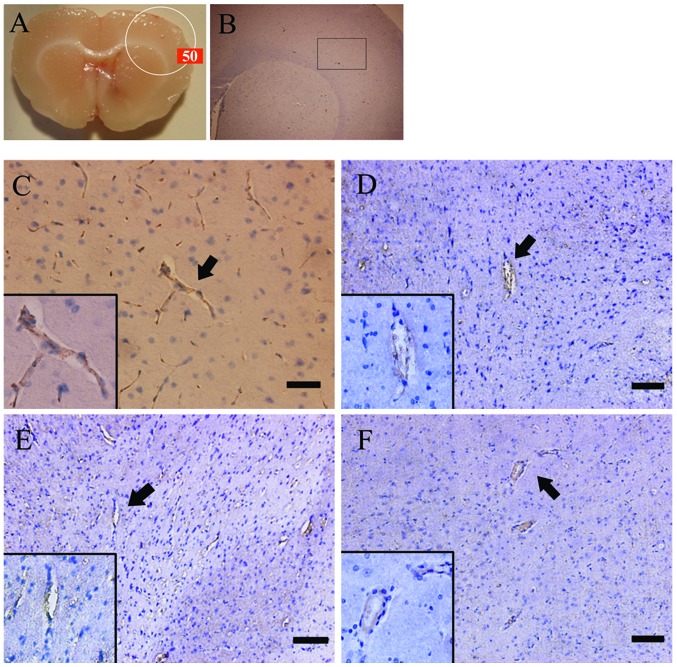
Figure 4.
Angiogenesis in the irradiated cortical area as demonstrated by immunochemistry. (A) Coronal section of the rat brain showing the 50% isodose curve with a maximal center dose of 60 Gy. (B) Microvascular morphology and density were observed by light microscopy in the area of the center maximum dose. Magnification, ×40. (C) Presentative immunohistochemistry fields of CD31 (endothelial marker) in the cortex of the normal control. Magnification, ×200 (D) 4 weeks post irradiation, vessel density was significantly reduced in irradiated tissue. Magnification, ×100 (E) Vessel density was moderately increased 16 weeks later compared with the controls and vacuolization was observed in the irradiated tissue. Magnification, ×100 (F) 24 weeks post irradiation the vessel density was reduced to control levels in irradiated tissue. Magnification, ×100. Scale bars=150 μm in B, C and D.

