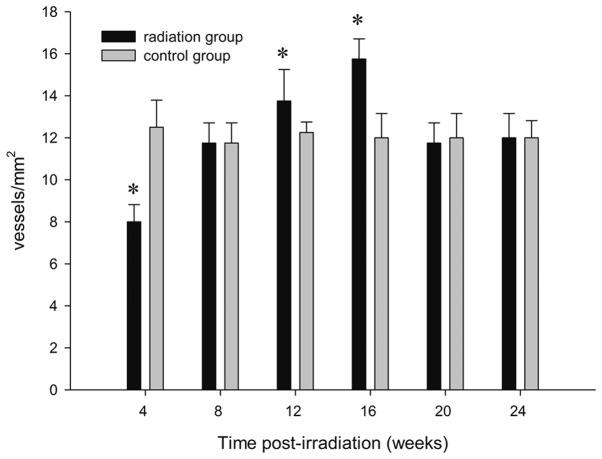
Figure 5.
Bar graph representing the number of endothelial cells (positive for CD31) per highpower field. The average signal for each animal (based on five areas) is plotted over 6 months, showing a difference between GKS-treated and control animals. The data are presented as the mean ± standard deviation. *P<0.05, compared with the sham group.

