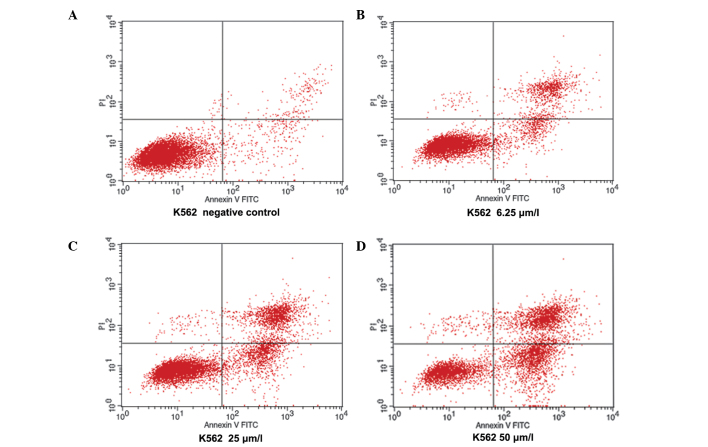
Figure 7.
Flow cytometric analysis of apoptotic cells treated with virosecurinine. Apoptotic rates were determined using fluorescence activated cell sorting following virosecurinine treatment in K562 cells. (A) Normal K562 cells. (B-D) K562 cells treated with 6.25, 25 and 50 μmol/l virosecurinine for 48 h, respectively. FITC, fluorescein isothiocyanate.

